

Your IT team is stuck with clunky reporting tools that require manual exports and spreadsheet gymnastics. Helpdesk reporting should give you visibility into what's working and what's not, without hours spent building custom reports. We tested some of the best ITSM tools for analytics and reporting to find which ones actually make service desk data useful.
TLDR:
ITSM analytics track ticket volumes, resolution times, and SLA compliance automatically.
Ravenna measures AI automation ROI by showing which tickets AI resolves vs human agents.
Legacy tools require separate portals while Ravenna delivers analytics directly in Slack.
Ravenna is a Slack-native ITSM tool with built-in analytics and AI automation.
What is ITSM Analytics and Reporting?
ITSM analytics and reporting tools convert raw service desk data into actionable insights about IT service management (ITSM) performance. These systems track metrics such as ticket volumes, resolution times, SLA compliance, and customer satisfaction.
Visibility drives better decisions. When you see patterns in your support data, you can adjust staffing, streamline handoffs, and allocate resources more effectively. A well-designed analytics system shows where bottlenecks occur, which issues consume the most time, and how performance trends over time.
With 88% of organizations now using at least one ITSM solution, your ability to identify the small set of tickets that drive most productivity loss becomes a competitive advantage.
ITSM analytics solutions present information through dashboards and scheduled reports. Dashboards provide current snapshots of key metrics, while reports show historical trends. Basic reporting covers ticket counts and response times. Advanced analytics can surface correlations, forecast ticket volumes, and measure the business impact of service disruptions.
How We Assessed ITSM Analytics and Reporting Tools
We assessed these ITSM tools using criteria that matter most for service desk performance and ROI across support teams.
Our key evaluation factors included:
Real-time dashboard functionality that surfaces critical metrics without manual report generation
Customizable reporting options that adapt to different team workflows and stakeholder needs
AI-driven insights that go beyond basic counts to identify patterns and predict trends
Integration capabilities with knowledge bases, documentation tools, and knowledge management workflows
Data visualization quality, reporting functions, and ease of interpretation for non-technical stakeholders
Support performance tracking including ticket volumes, resolution times, and SLA compliance
AI impact measurement showing automation ROI and time saved through intelligent assistance
These criteria focus on visibility into service operations and data you can use to optimize and validate improvements.
Best Overall ITSM Analytics and Reporting Tool: Ravenna
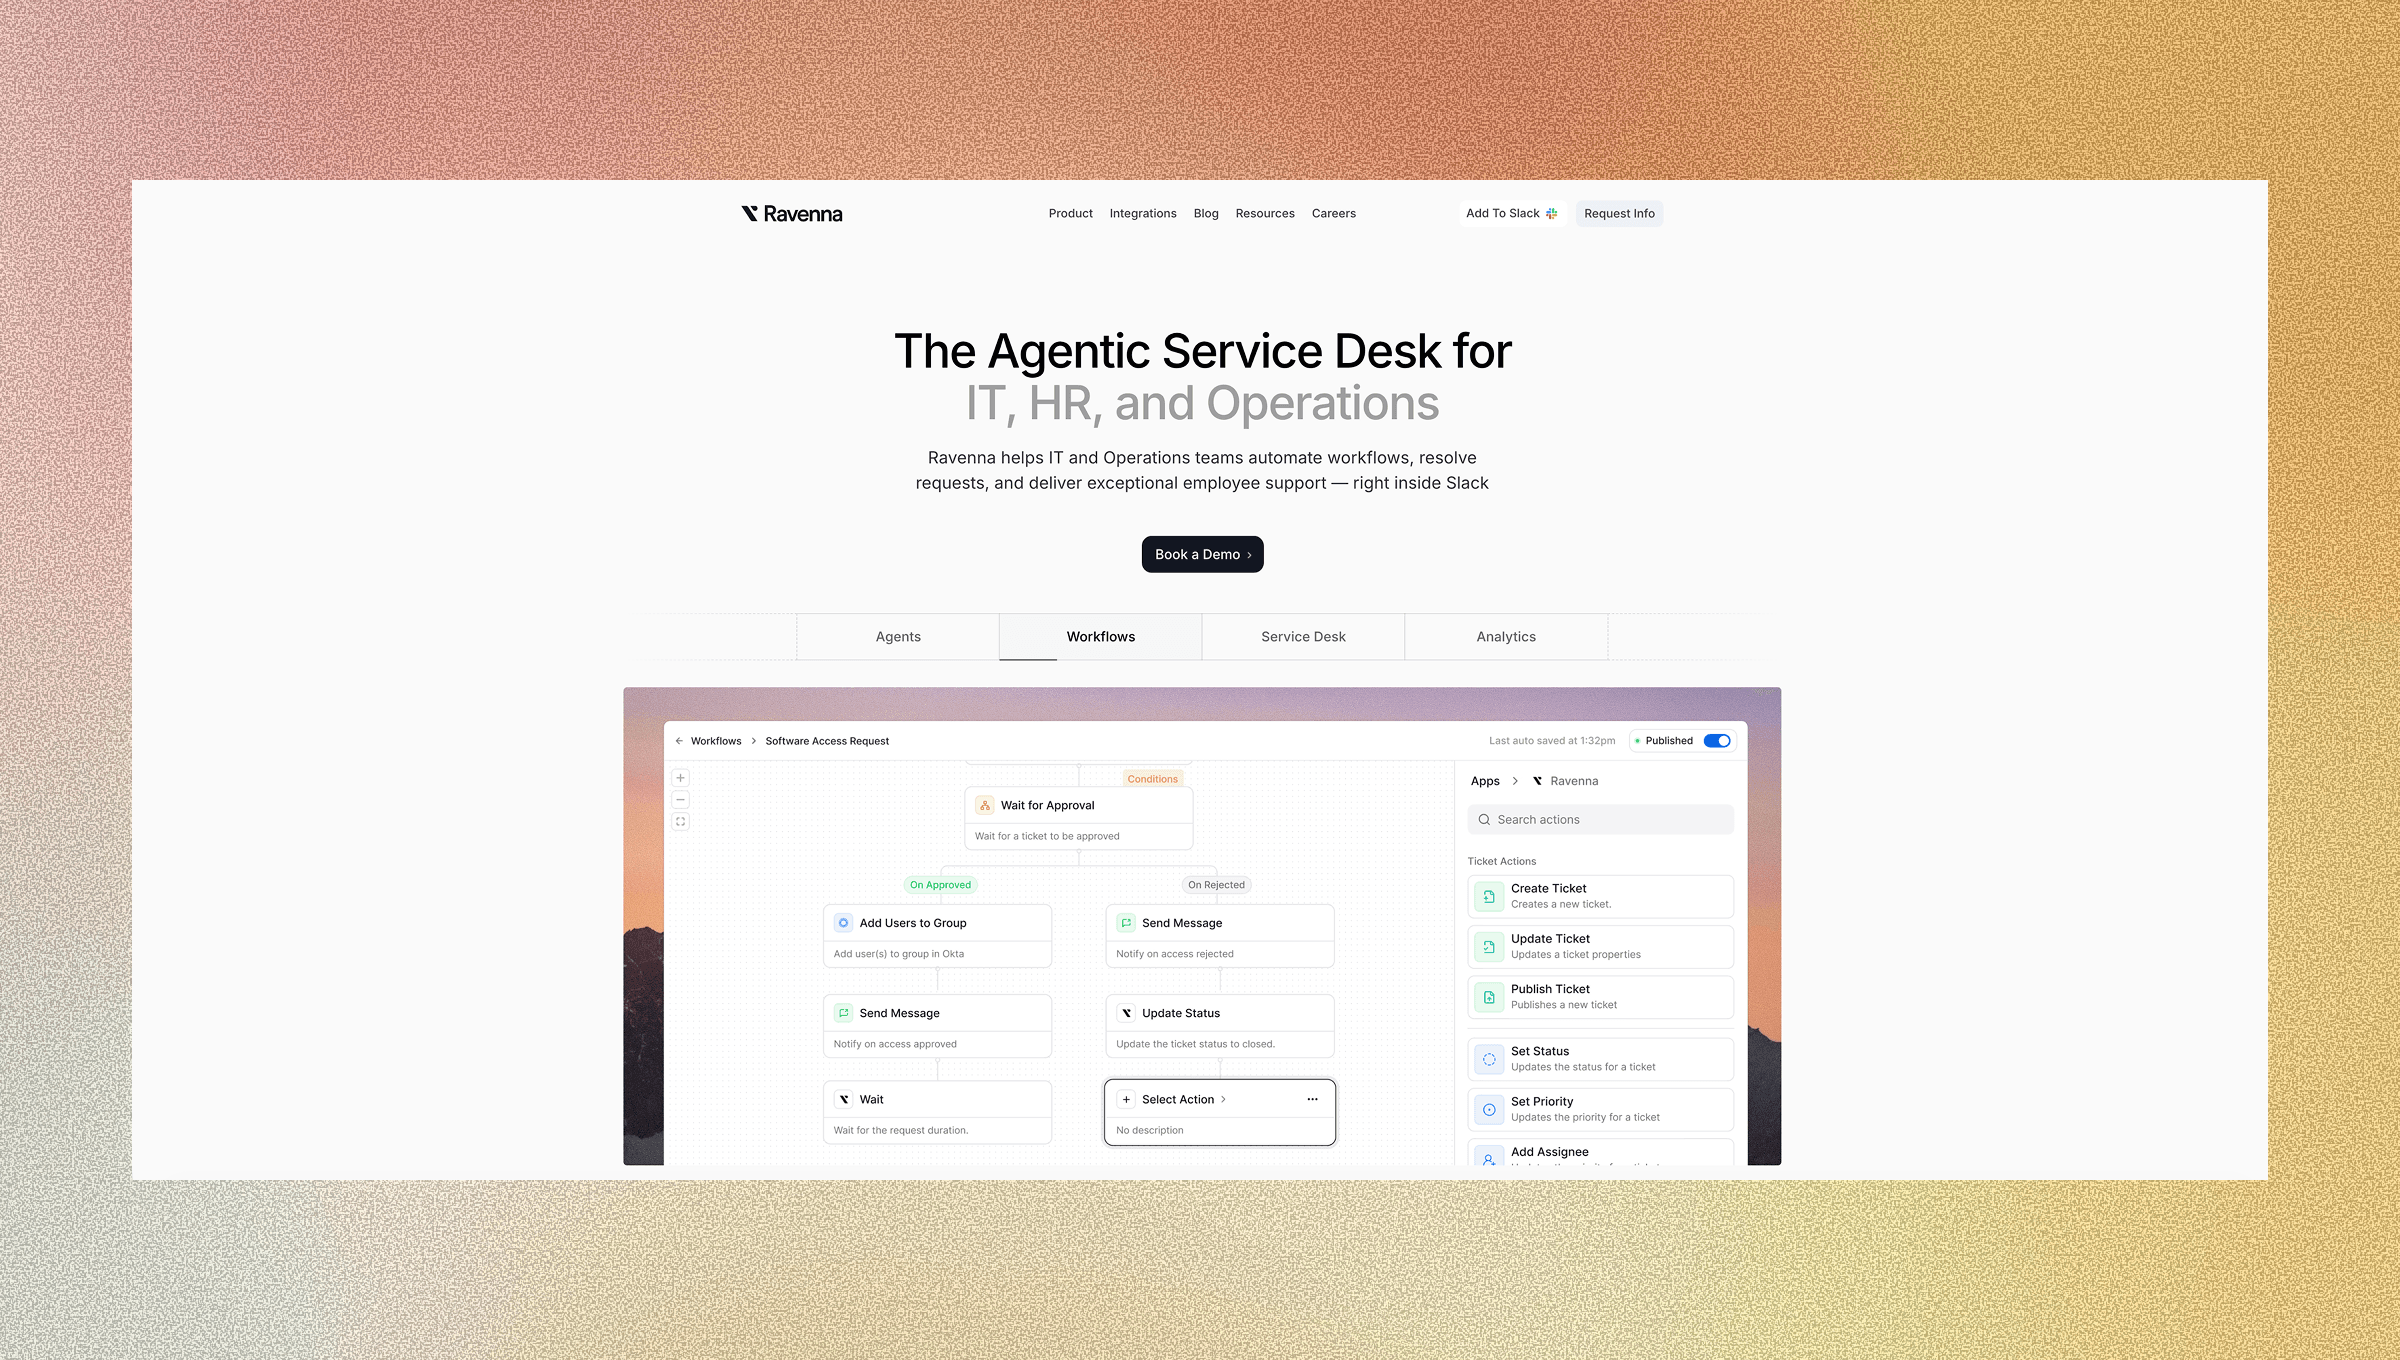
Ravenna is a Slack-native workflow automation tool that manages end-to-end workflows across your SaaS stack. While other tools focus on tracking tickets, Ravenna can execute tasks across systems like Okta, BambooHR, and Jamf to handle access requests, employee lifecycle workflows, and device management with less manual effort.
Key Features
Ravenna's tool includes:
Visual workflow builder with drag-and-drop automation design that lets teams create complex workflows without coding.
Agentic interface with specialized AI agents for IT, HR, and Operations that classify intent, understand context, and execute tasks autonomously.
Deep SaaS integrations with Okta, Google Workspace, BambooHR, HiBob, Rippling, Jamf, and Kandji for automated access management, employee lifecycle, and device management.
Analytics dashboards that track both traditional support metrics and AI automation impact, measuring tickets resolved by AI versus human agents and quantifying time saved.
Ravenna performs work across your SaaS stack. The visual workflow builder and agentic AI interface handle complex multi-step processes like access provisioning and employee onboarding end-to-end. Built-in analytics show your automation ROI by measuring which workflows AI completes versus those requiring human intervention, all within Slack where your team already works.
ServiceNow Performance Analytics
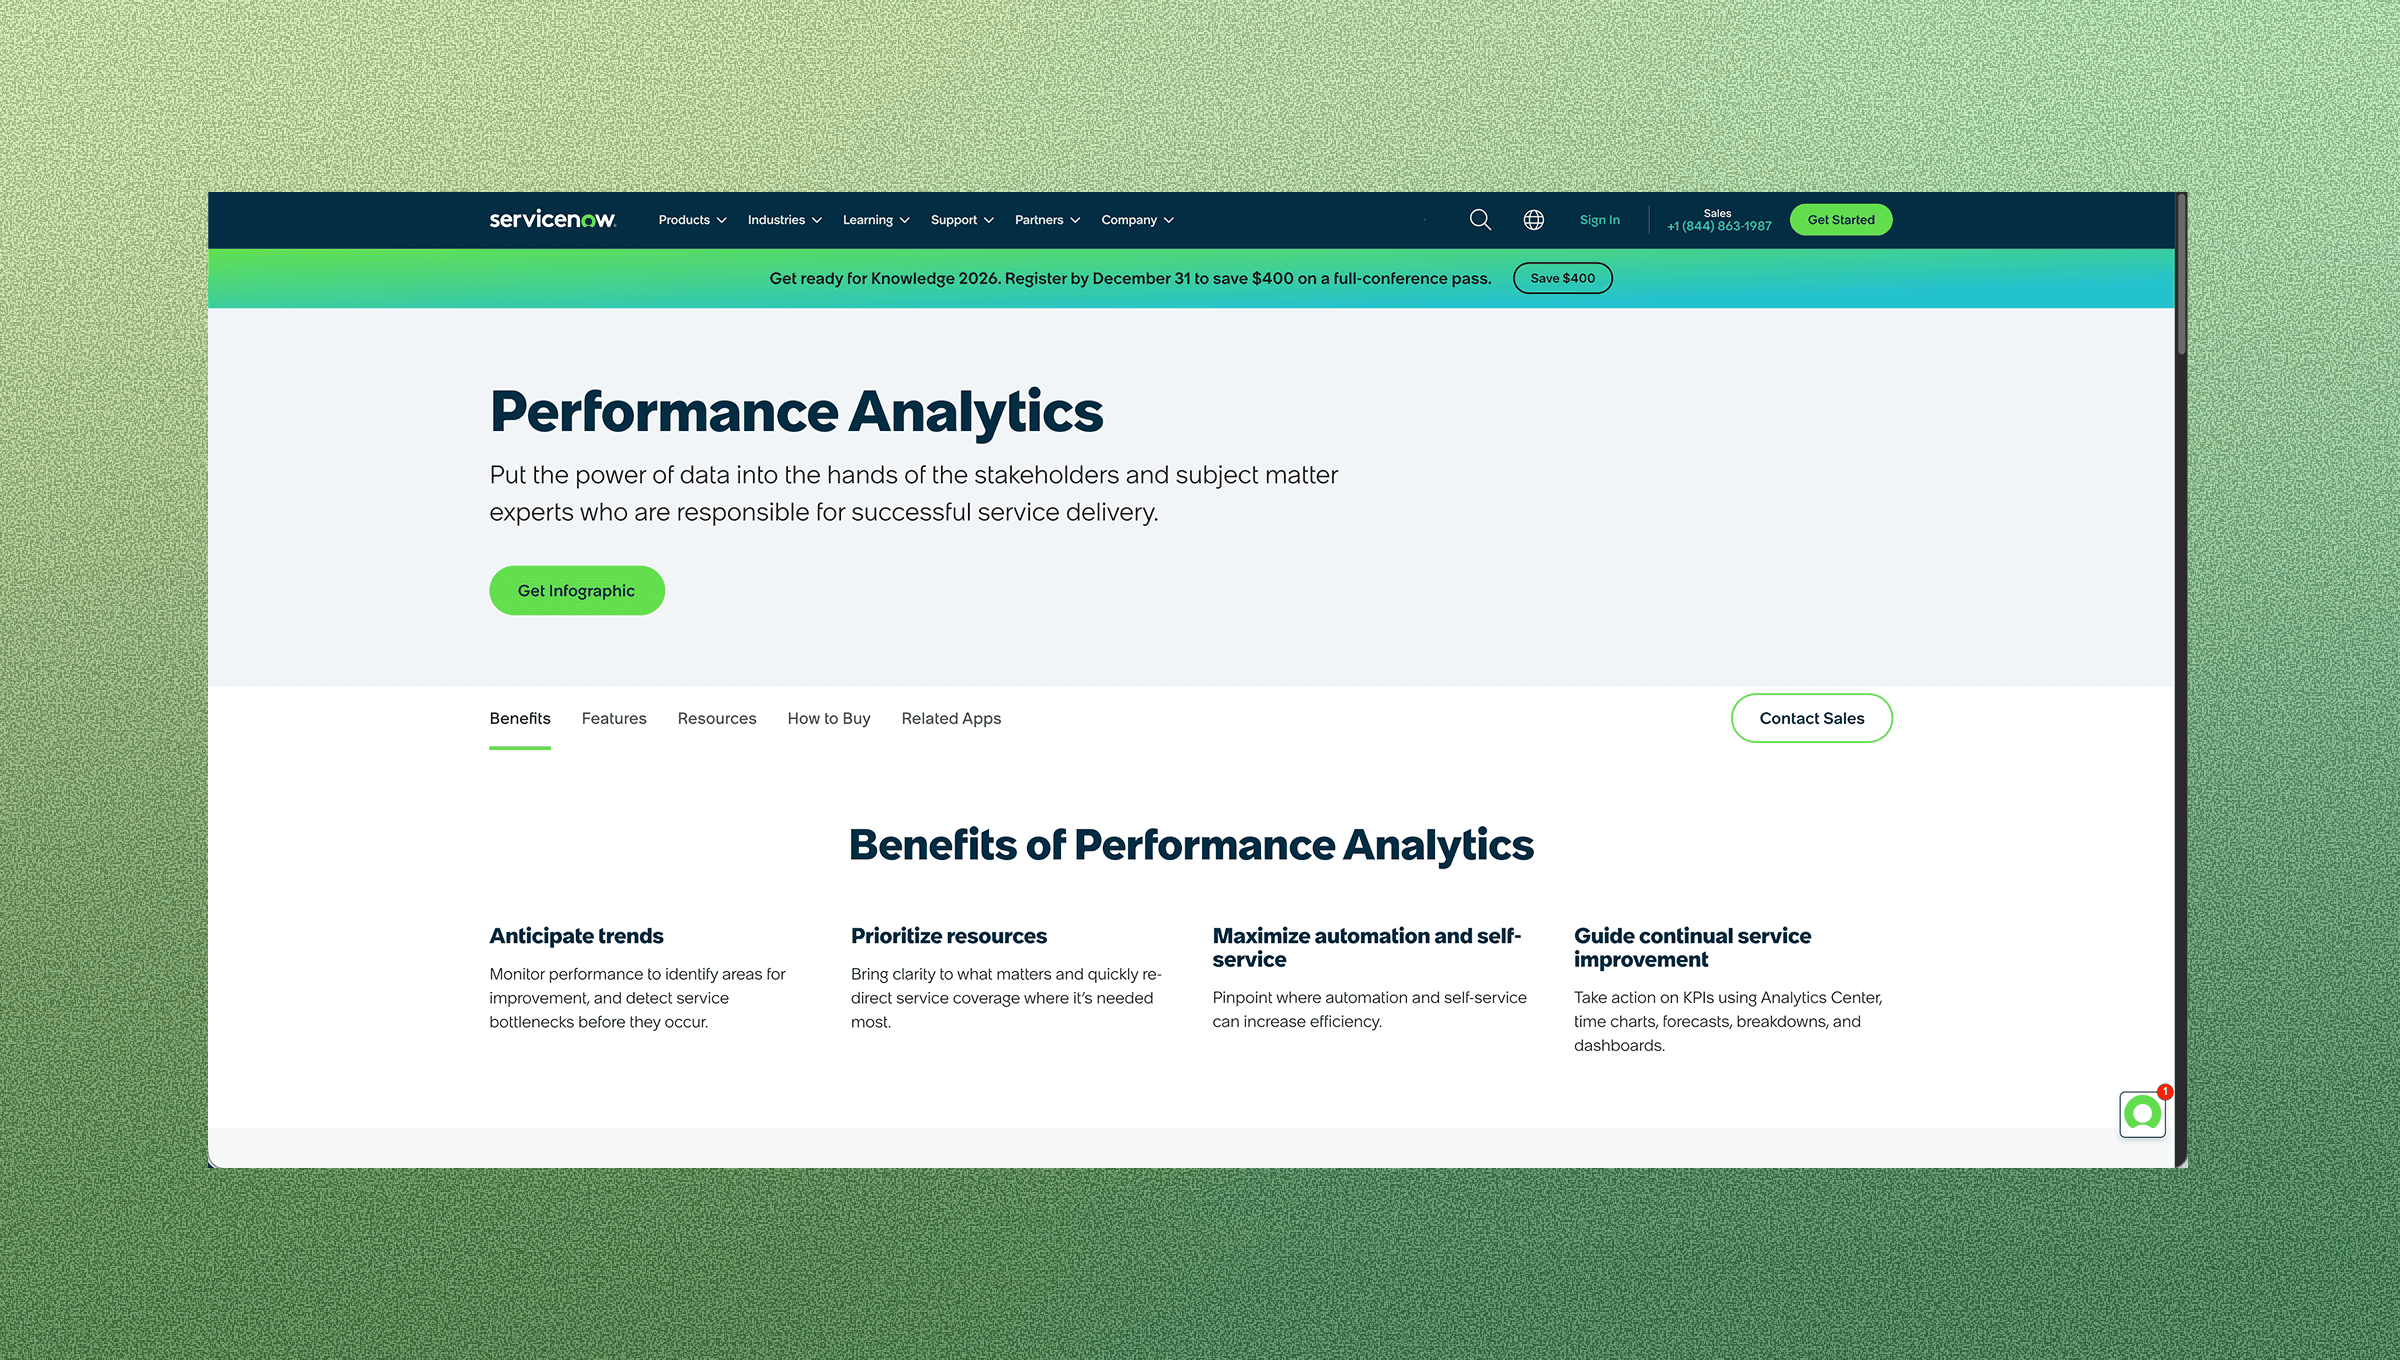
ServiceNow Performance Analytics is an add-on module with 600+ predefined KPIs interactive dashboards, and historical trend and forecasting features for ITSM reporting.
Key Features
ServiceNow Performance Analytics offers a number of features for ITSM analytics and reporting:
Real-time performance monitoring with automated dashboard updates that refresh as incident, problem, and change data flows through the system.
Historical data analysis with trend forecasting that helps predict future ticket volumes and resource requirements.
Drill-down capabilities that let analysts move from high-level metrics to individual ticket details for root cause analysis.
Pre-built ITSM indicators covering common service desk KPIs alongside customizable tracking for organization-specific metrics.
The Limitations
Performance Analytics requires an add-on beyond base ServiceNow ITSM, increasing cost and complexity. As a portal-based system, employees must leave Slack to submit requests, adding friction if work already happens in channels and DMs. While ServiceNow excels at governance-first ITSM with strong SLA tracking, ITIL workflows, and enterprise reporting, executing tasks across your SaaS stack (e.g., Okta access, Jamf actions, BambooHR updates) often requires manual work or heavy configuration, and native AI automation ROI tracking is limited.
It’s best suited for large enterprises seeking a highly configurable system of record with dedicated admin teams and longer rollout timelines.
Freshservice Analytics
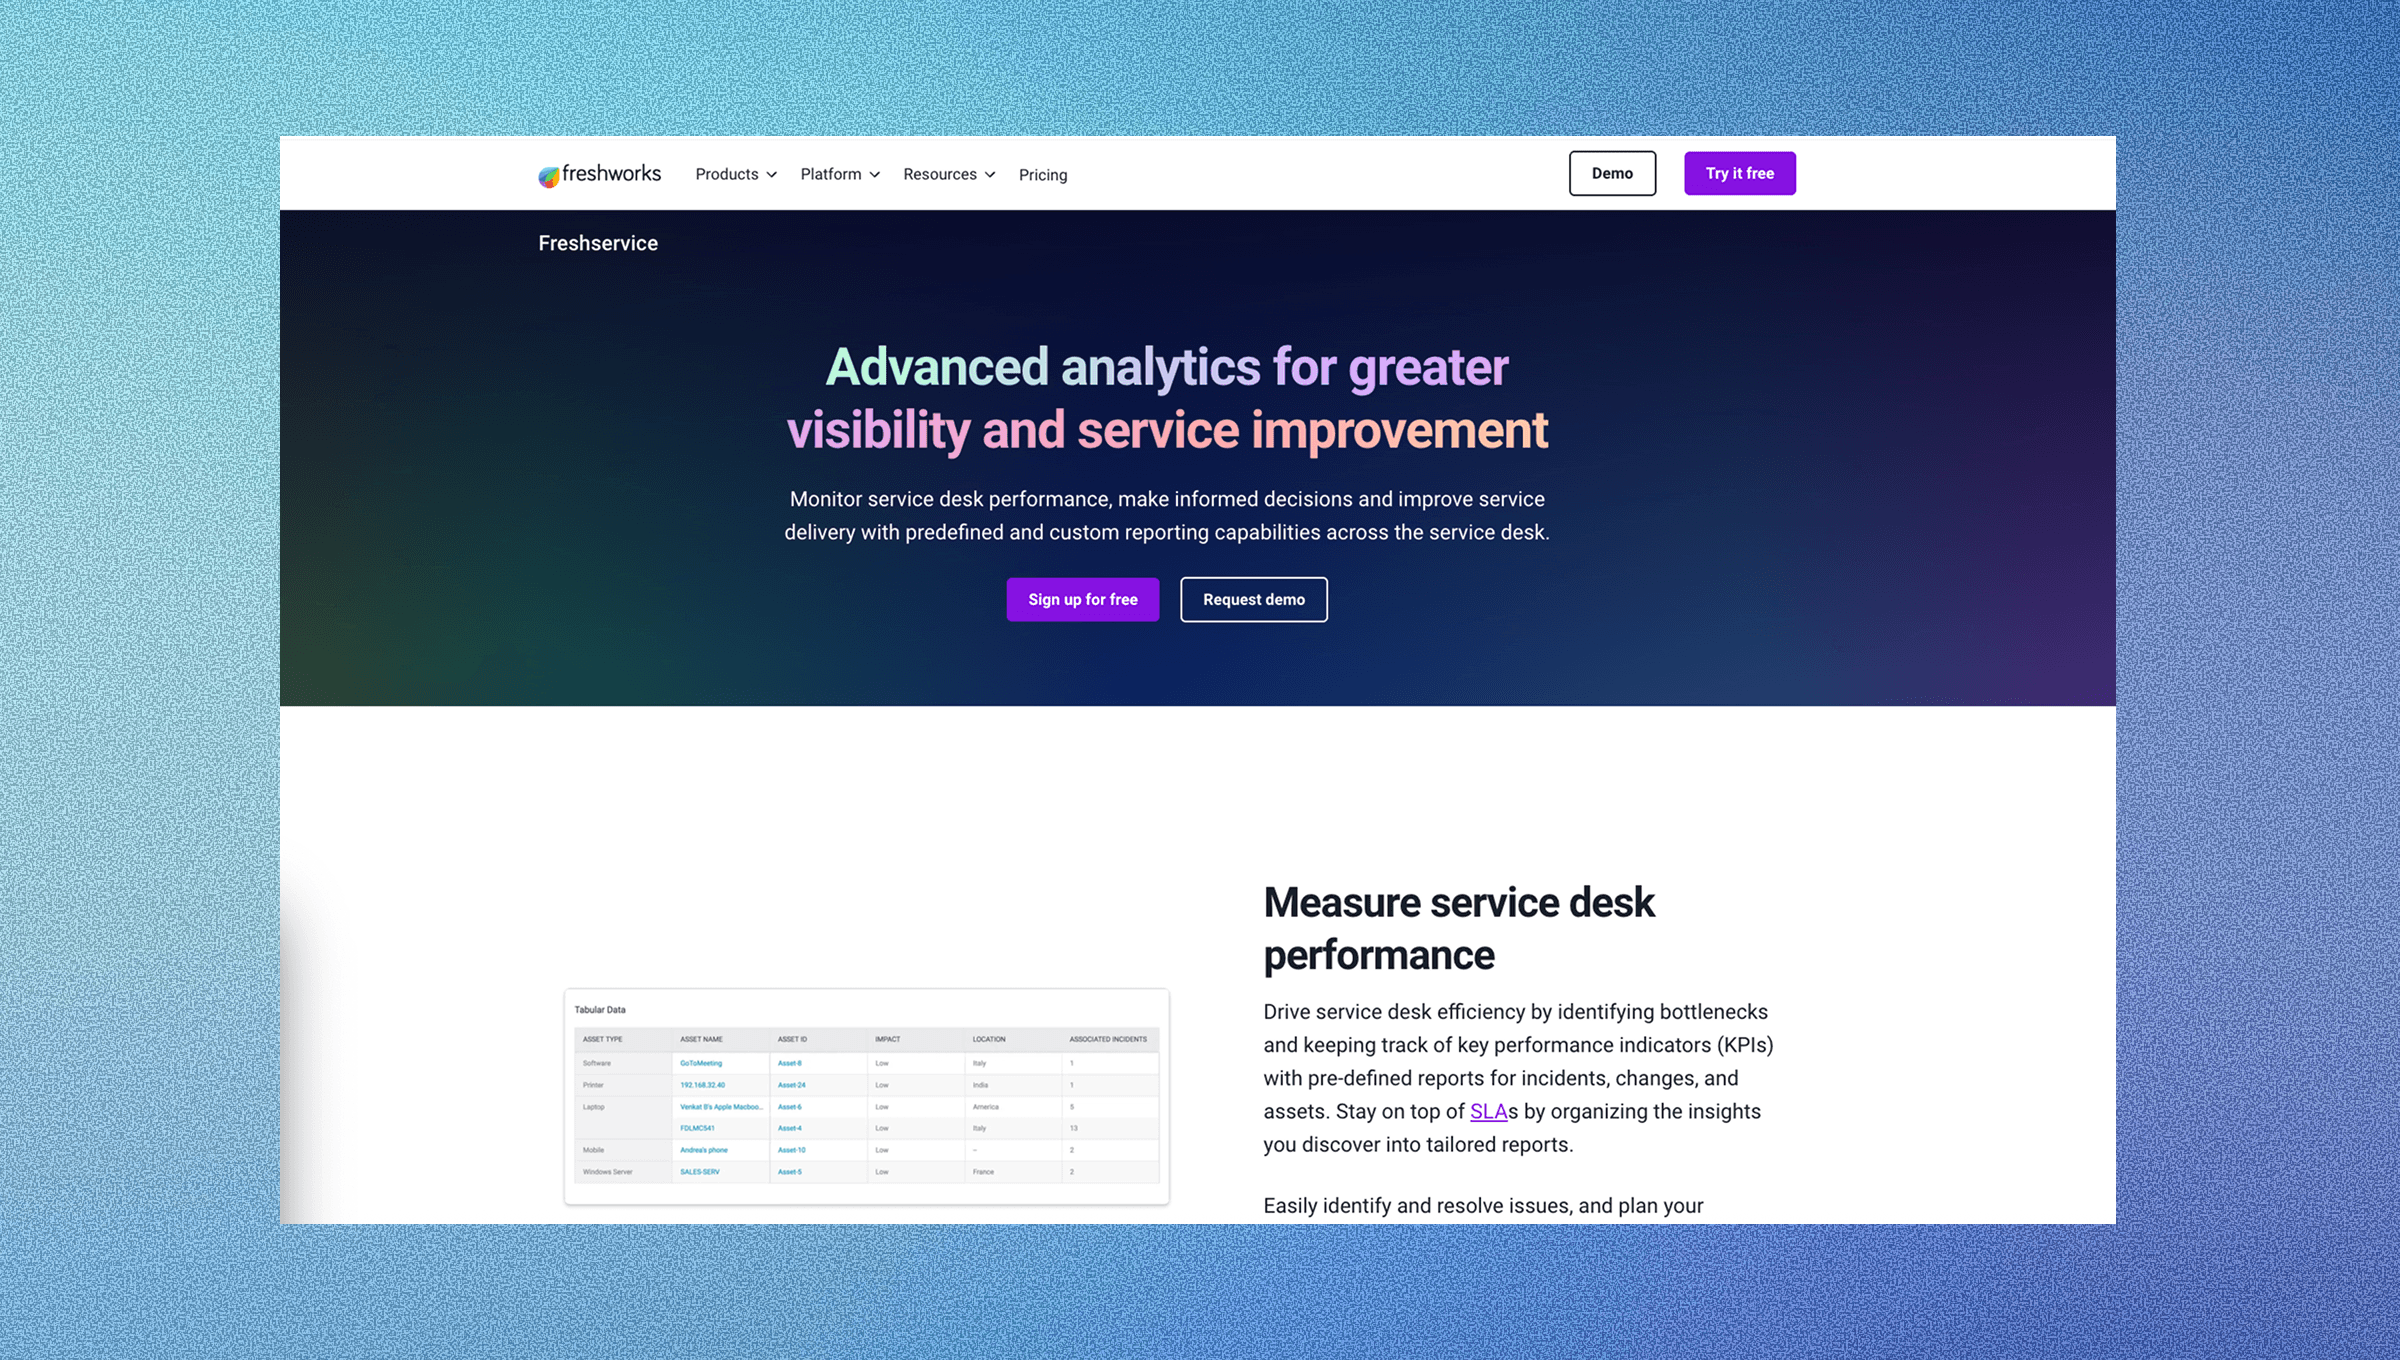
Freshservice, from Freshworks, provides built-in analytics with customizable dashboards and pre-built reports. It’s a ticket-first, portal-centric ITSM tool focused on service requests, SLAs, service catalogs, and ITIL-aligned workflows through an agent console and self-service portal.
Key Features
Freshservice Analytics offers a number of features for ITSM analytics and reporting:
Pre-built dashboards covering incident, problem, change, and asset management with drag-and-drop widgets that let teams customize views without technical expertise.
Real-time ticket metrics showing volume trends, agent workload distribution, and backlog status across service desk operations.
SLA compliance tracking with visual indicators for at-risk and breached tickets that help managers identify performance issues before they escalate.
Agent productivity reports measuring response times, resolution rates, and ticket ownership patterns to identify top performers and training opportunities.
Customer satisfaction surveys with automated collection after ticket resolution and trend analysis showing satisfaction scores over time.
Scheduled report delivery via email for stakeholders who need regular updates without logging into the tool.
The Limitations
Freshservice uses a portal-first model that requires employees to leave Slack to submit requests, adding friction when work already happens in channels and DMs. It focuses on ticket routing and tracking, with actual task execution typically requiring manual agent work or added integrations. Native AI automation tracking is limited, making it difficult to measure auto-resolution rates or ROI. While strong for IT service desk operations, cross-functional use across IT, HR, and Ops often requires separate initiatives, and advanced forecasting or predictive analytics typically depend on external BI tools.
Freshservice works well for IT departments that want a cloud ITSM service desk with tickets, SLAs, and ITIL-aligned processes, especially those comfortable with portal-based workflows and dashboard-based reporting.
Jira Service Management Reporting
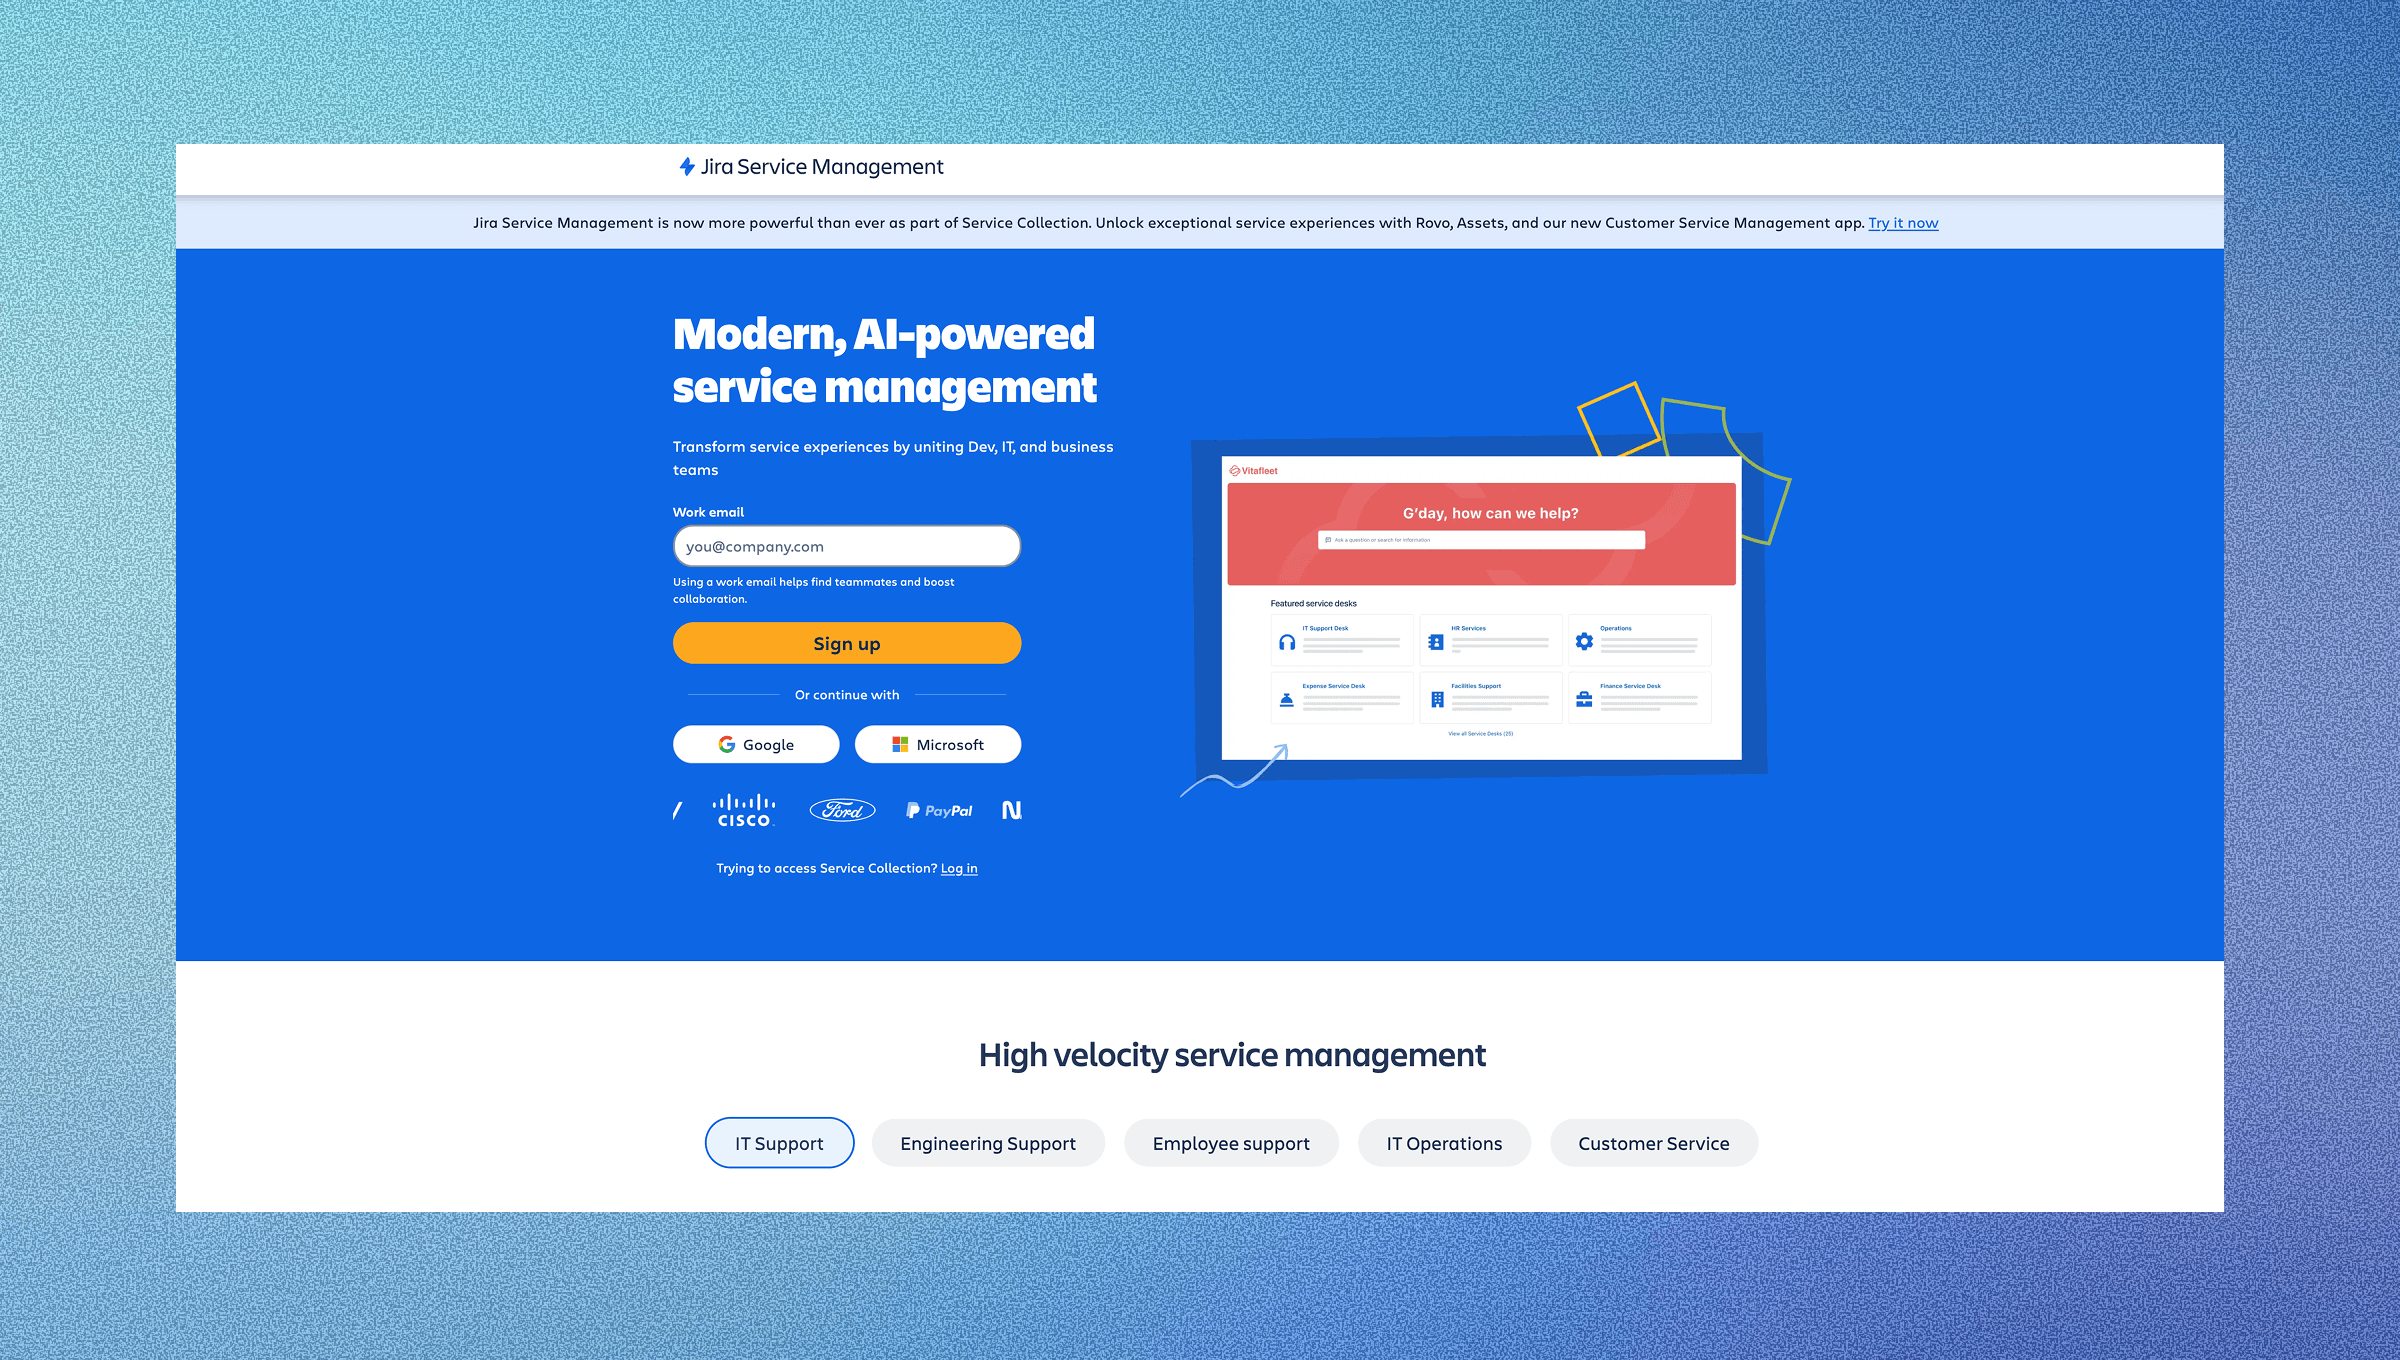
Jira Service Management includes reporting capabilities integrated with Atlassian's ecosystem. Built as a ticket-first ITSM tool, JSM focuses on managing service delivery through queues, SLAs, and ITIL workflows within the Jira environment, making it well-suited for organizations already invested in the Atlassian ecosystem that focuses on ticket management over workflow execution.
Key Features
Jira Service Management Reporting offers a number of features for ITSM analytics and reporting:
Native integration with Jira dashboards and Confluence that lets teams create unified views combining service desk metrics with development project data.
Customizable gadgets for tracking ticket volumes, resolution times, SLA performance, and agent workload across service desk operations.
Agile workflow reporting that connects service requests to development sprints, helping teams understand the relationship between support issues and product improvements.
Cross-project reporting capabilities that span both Jira Software and Service Management instances for organizations managing multiple service desks.
Time tracking reports showing how agents spend time across different issue types and projects to identify resource allocation opportunities.
The Limitations
Jira Service Management uses a portal-first model that requires employees to leave Slack to submit requests, creating friction when support already happens in channels and DMs. Its reporting relies on Jira’s dashboard and gadget framework, which can be complex for non-technical stakeholders. JSM is built for ticket management, while it routes and tracks requests, actual task execution typically requires manual work or additional integrations. It also lacks native AI automation tracking, making it difficult to measure auto-resolution rates or ROI, and cross-functional use across IT, HR, and Ops often requires separate projects rather than a unified support layer.
Jira Service Management is a strong fit for engineering-led teams in the Atlassian ecosystem that need ticket-first ITSM with SLA tracking and ITIL workflows, plus tight integration with Jira Software and Confluence.
SysAid Analytics
SysAid offers a built-in business intelligence analytics tool with standard reporting for tracking ITSM performance and IT asset data.
Key Features
SysAid offers a number of features for ITSM analytics and reporting:
Built-in BI analytics with predefined KPIs for tracking ticket resolution times, SLA compliance, and technician workload across service desk operations.
Customizable dashboards that let teams configure widgets and visualizations to monitor specific performance indicators relevant to their IT operations.
IT asset management and asset tracking reports that connect hardware and software data to service requests, helping teams understand the relationship between assets and incidents.
Benchmarking capabilities that compare your service desk metrics against industry statistics to identify performance gaps.
The Limitations
SysAid requires logging into a separate portal for dashboards and reports, creating friction for teams that work primarily in Slack or Microsoft Teams. It also lacks native AI automation tracking, making it difficult to measure auto-resolution rates or quantify automation ROI.
SysAid is a good fit for IT teams that want service desk and asset management in one platform, with built-in BI and inventory reporting for unified visibility.
Xurrent Analytics and Dashboards
Xurrent delivers over 400 pre-built reports and real-time dashboards with a no-code builder that provides insights without extensive configuration.
Key Features
Xurrent Analytics and Dashboards offers a number of features for ITSM analytics and reporting:
Pre-built reports based on ITIL frameworks covering incident, problem, change, and service request management without requiring custom development.
No-code dashboard builder that lets teams create custom visualizations and performance views tailored to specific organizational needs.
Real-time performance monitoring through interactive dashboards that update automatically as tickets, incidents, and service requests change status.
Industry benchmarking tools that compare your service desk metrics against similar organizations to identify performance gaps and improvement opportunities.
Customizable KPI tracking that allows teams to define and monitor organization-specific metrics beyond standard ITSM measurements.
The Limitations
Xurrent is a standalone SaaS platform with no native Slack or Microsoft Teams integration, requiring context switching to a separate portal for analytics. It also lacks native AI automation tracking, making it difficult to measure auto-resolution rates or quantify automation ROI.
Xurrent is well-suited for service providers and multi-tenant organizations needing extensive, ITIL-aligned reporting, with 400+ pre-built reports and a no-code dashboard builder. However, its portal-based model disrupts Slack or Teams workflows, and it lacks visibility into AI automation impact and measurable efficiency gains.
Feature Comparison Table of ITSM Analytics and Reporting Tools
Feature | Ravenna | ServiceNow | Freshservice | Jira Service Management | SysAid | Xurrent |
Real-time Dashboards | ✓ | ✓ | ✓ | ✓ | ✓ | ✓ |
AI Impact Tracking | ✓ | ✗ | ✗ | ✗ | ✗ | ✗ |
Slack/Teams Integration | ✓ | ✗ | ✗ | ✗ | ✗ | ✗ |
Customizable Reporting | ✓ | ✓ | ✓ | ✓ | ✓ | ✓ |
Pre-built Templates | ✓ | ✓ | ✓ | ✓ | ✓ | ✓ |
Knowledge Base Analytics | ✓ | Limited | ✗ | ✗ | ✗ | ✗ |
Ravenna measures your AI automation ROI and delivers analytics directly in Slack. Legacy tools require separate portals and lack visibility into intelligent automation impact.
Why Ravenna is the Best Workflow Automation Solution for Internal Support
Ravenna automates what many ITSM tools mainly track. Traditional platforms can show ticket counts and response times, but agents still execute many requests manually. Ravenna's agentic service desk can run workflows across your SaaS stack with less manual effort.
Ravenna offers three key advantages: automation-first workflows across your SaaS stack, analytics that track AI versus human task completion to measure ROI, and Slack-native delivery that keeps requests and reporting in one place. Its visual workflow builder lets teams manage automations without coding.
Final Thoughts on ITSM Performance Analytics
IT performance analytics should make decisions easier, not add more busywork. For internal IT support, you need visibility into operations and proof that automation delivers value. When you evaluate ITSM tools, look for an ITSM platform that pairs reporting with execution, and make sure pricing aligns with the outcomes you need, not just the number of dashboards.
To see how this works with your workflows, schedule a demo with us.
FAQ
How do I choose the best ITSM analytics tool for my team?
Start by deciding whether you need AI automation tracking or only traditional service desk metrics. If you work primarily in Slack or Teams, choose a tool with native integration. For large enterprises with complex IT service management environments, consider platforms like ServiceNow that support deeper forecasting and reporting.
Which ITSM reporting tool works best for small teams versus enterprises?
Small teams benefit from Freshservice's simple dashboards and quick setup. Mid-sized organizations often prefer Ravenna for Slack-native analytics with AI tracking. Large enterprises typically need ServiceNow or Xurrent for multi-tenant reporting and ITIL framework support. The right ITSM software depends on how much you need reporting versus end-to-end workflow execution.
Can I measure the ROI of AI automation in my service desk?
Most legacy ITSM tools cannot track AI impact separately from human agent work. Ravenna measures tickets resolved by AI versus agents, calculating time saved and deflection rates that prove automation value.
What's the difference between real-time dashboards and scheduled reports?
Real-time dashboards show current metrics as tickets change, helping managers spot issues immediately. Scheduled reports provide historical analysis and trend data over weeks or months, useful for strategic planning and performance reviews.
When should I consider upgrading from basic ticket counting to advanced analytics?
Upgrade when you need to forecast future ticket volumes, identify patterns between issue types and resolution methods, or measure the business impact of service disruptions. Basic reporting suffices if you only need response times and ticket counts.


