

You've probably spent countless hours pulling together ITSM reports that nobody uses to make decisions. Most IT teams are drowning in data but starving for actionable insights that improve IT service delivery. The right reporting strategies can shift ITSM from reactive firefighting to proactive service excellence. Modern ITSM reporting tools make it easier to turn service data into strategic business value.
TLDR:
Strategic ITSM reporting connects IT metrics to business outcomes, not vanity metrics like ticket counts.
Forecasting and trend-detection analytics can cut unplanned downtime by 45% through proactive issue detection.
Real-time dashboards eliminate manual reporting tasks and provide instant visibility into service performance.
Continuous improvement cycles using performance data turn IT from a cost center into a value driver.
Ravenna automates end-to-end workflows in Slack with embedded analytics for actionable service insights.
Understanding ITSM and Its Current Challenges
IT Service Management (ITSM) represents the complete approach to designing, delivering, managing, and improving IT services within an organization. IT service management encompasses everything from incident management to change management to IT asset management, but many teams struggle with outdated processes that can't keep up with today's demands. Traditional ITSM frameworks like ITIL focus heavily on structured processes and documentation. While these provide valuable governance, they often create rigid systems that slow down response times and frustrate users who expect instant solutions.
Only 9% of IT organizations currently measure performance using business-success-related metrics in addition to traditional ITSM KPIs, creating a massive gap between what teams track and what actually drives business value.
The biggest challenge is that most service desk tools force teams into separate portals and complex workflows that disconnect them from their daily work environment. Your team lives in Slack but has to jump to another system for every ticket, so productivity suffers.
Modern workflow automation must integrate smoothly with existing tools and teams. That is where AI-native approaches come in, shifting reactive ticket management to proactive service delivery. Instead of waiting for users to report problems, smart systems identify request patterns, recurring friction points, and workload spikes before they impact service quality. They can reduce incident volume by eliminating repeatable failure paths through automation.
The shift from reactive to proactive service management requires strong reporting capabilities. Without clear visibility into service performance, team workload, and user satisfaction, IT teams operate blindly. This is why strategic ITSM reporting is critical for organizational success in 2025.
Here are four ITSM best practices to follow to improve your service desk performance:
1. Build a Strategic Reporting Framework Aligned with Business Goals
Building an effective ITSM reporting framework starts with connecting IT metrics directly to business outcomes. Too many organizations track vanity metrics that look impressive but fail to improve service delivery and customer satisfaction.
The key is distinguishing between daily metrics and strategic KPIs. Daily metrics track routine service delivery, while strategic KPIs link directly to organizational goals. Every metric you measure should serve a clear purpose. When deciding which IT metrics to track, consider their impact on both the IT department and the broader business.
Avoid the temptation to create generic, tell-all reports for large audiences. Instead, meet with key stakeholders and agree on the right measurements to help them achieve their specific goals. This targeted approach makes your reporting actually influence decision-making. Consider the following metric types, their business impact, reporting frequency, and which stakeholders would be most interested in that kind of KPI.
Metric Type | Business Impact | Reporting Frequency | Stakeholder Focus |
Daily KPIs | Direct service delivery | Daily/Weekly | Service managers |
Strategic KPIs | Business alignment | Monthly/Quarterly | Executive leadership |
Leading Indicators | Predictive insights | Weekly | IT directors |
Lagging Indicators | Historical performance | Monthly | All stakeholders |
Your framework should create clear progression lines from lower-level metrics through KPIs to critical success factors. This creates transparency between IT support operations and business objectives.
It is important to understand the distinction between leading and lagging indicators. Leading indicators provide predictive insights that enable proactive management, while lagging indicators confirm whether strategies worked. Balancing both gives you complete visibility into service performance.
Modern workflow automation platforms can automatically capture the data needed for strategic reporting, eliminating manual collection efforts that often introduce errors and delays.
2. Trend-based Forecasting and Proactive Workflow Optimization
Trend-based forecasting changes ITSM from reactive firefighting to proactive service management. By analyzing historical patterns, AI can forecast potential issues before they impact end-users and optimize workflows, giving IT teams the advantage of prevention over cure.
The most effective predictive models focus on three core areas: incident prediction, capacity forecasting, and user behavior analysis. These models look at ticket volumes, system performance metrics, and user interaction patterns to identify new trends.
Machine learning algorithms integrated into workflow automation platforms like Ravenna detect subtle patterns humans might miss. Ravenna uses service and workflow telemetry to surface patterns that inform automation design and prioritization. It can predict when systems are likely to fail based on performance degradation, identify peak demand periods before they overwhelm resources, and flag users who may need additional support. It can also trigger preventive actions when predictions indicate potential problems, including proactive workflows, alerts, or automated resolutions.
Organizations using predictive analytics and real-time monitoring can see up to a 45% reduction in unplanned downtime, showing the real value of proactive reporting strategies.
Your predictive models are only as strong as the data and knowledge base behind them. Clean, consistent data from AI-powered systems provides the foundation for accurate forecasting. Once collected, the data should be rolled up into the metrics you have already identified. Some of the key metrics you might want to track to prove the ROI of your predictive analytics investment include prediction accuracy rates, time-to-detection improvements, and prevented incident counts.
Smart resource allocation based on predictive insights helps your team focus effort where it will have the greatest impact, instead of spreading resources thin across all possible issues.
3. Create Real-Time Dashboards and Visualization Tools
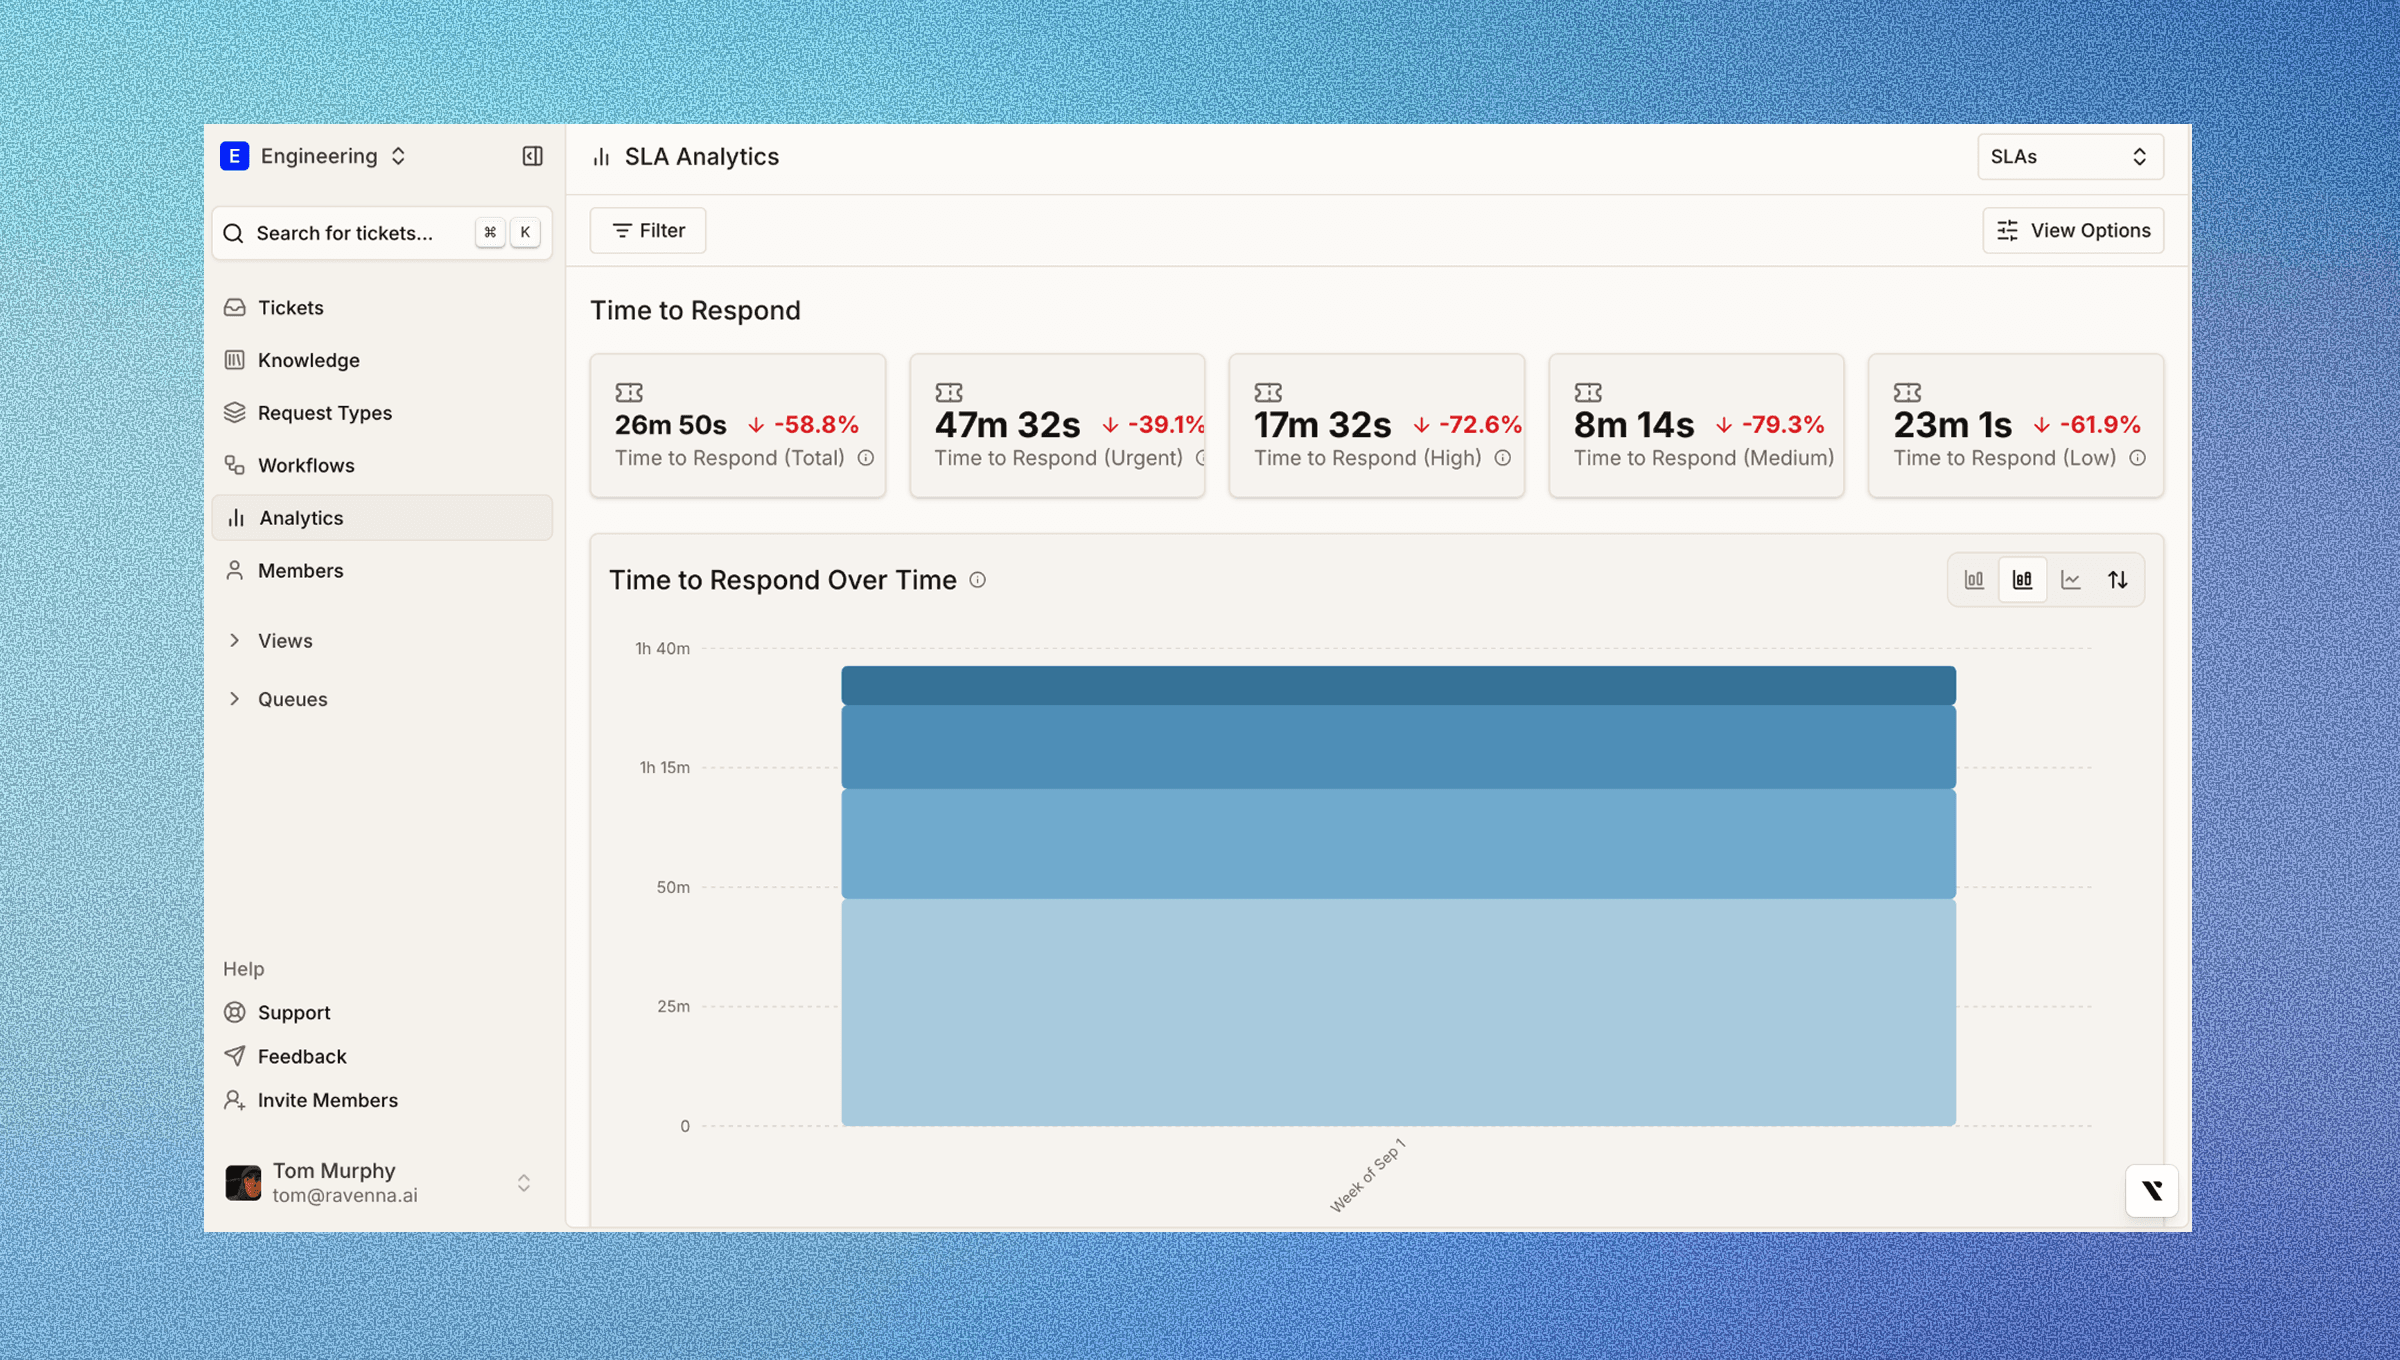
The key difference between dashboards and traditional reports lies in their purpose. Dashboards provide real-time monitoring for immediate action, while reports offer detailed analysis for strategic planning.
Real-time dashboards turn ITSM reporting from static snapshots into live, actionable intelligence. Instead of waiting for weekly reports, teams gain instant visibility into IT operations performance and can respond immediately to new issues.
The most effective dashboards focus on metrics that improve decision-making: ticket volumes, SLA compliance, mean time to resolution, and team workload distribution. These live visualizations remove manual reporting effort and provide continuously updated insights. They are also interactive, allowing users to drill down from high-level metrics to specific incidents or trends. This flexibility lets stakeholders view the same data from different perspectives without separate reports.
Modern workflow automation platforms integrate dashboard features directly into your daily workflows. For example, if your IT team works heavily in Slack, having real-time metrics accessible within the same environment eliminates the burden of context switching and naturally improves response times.
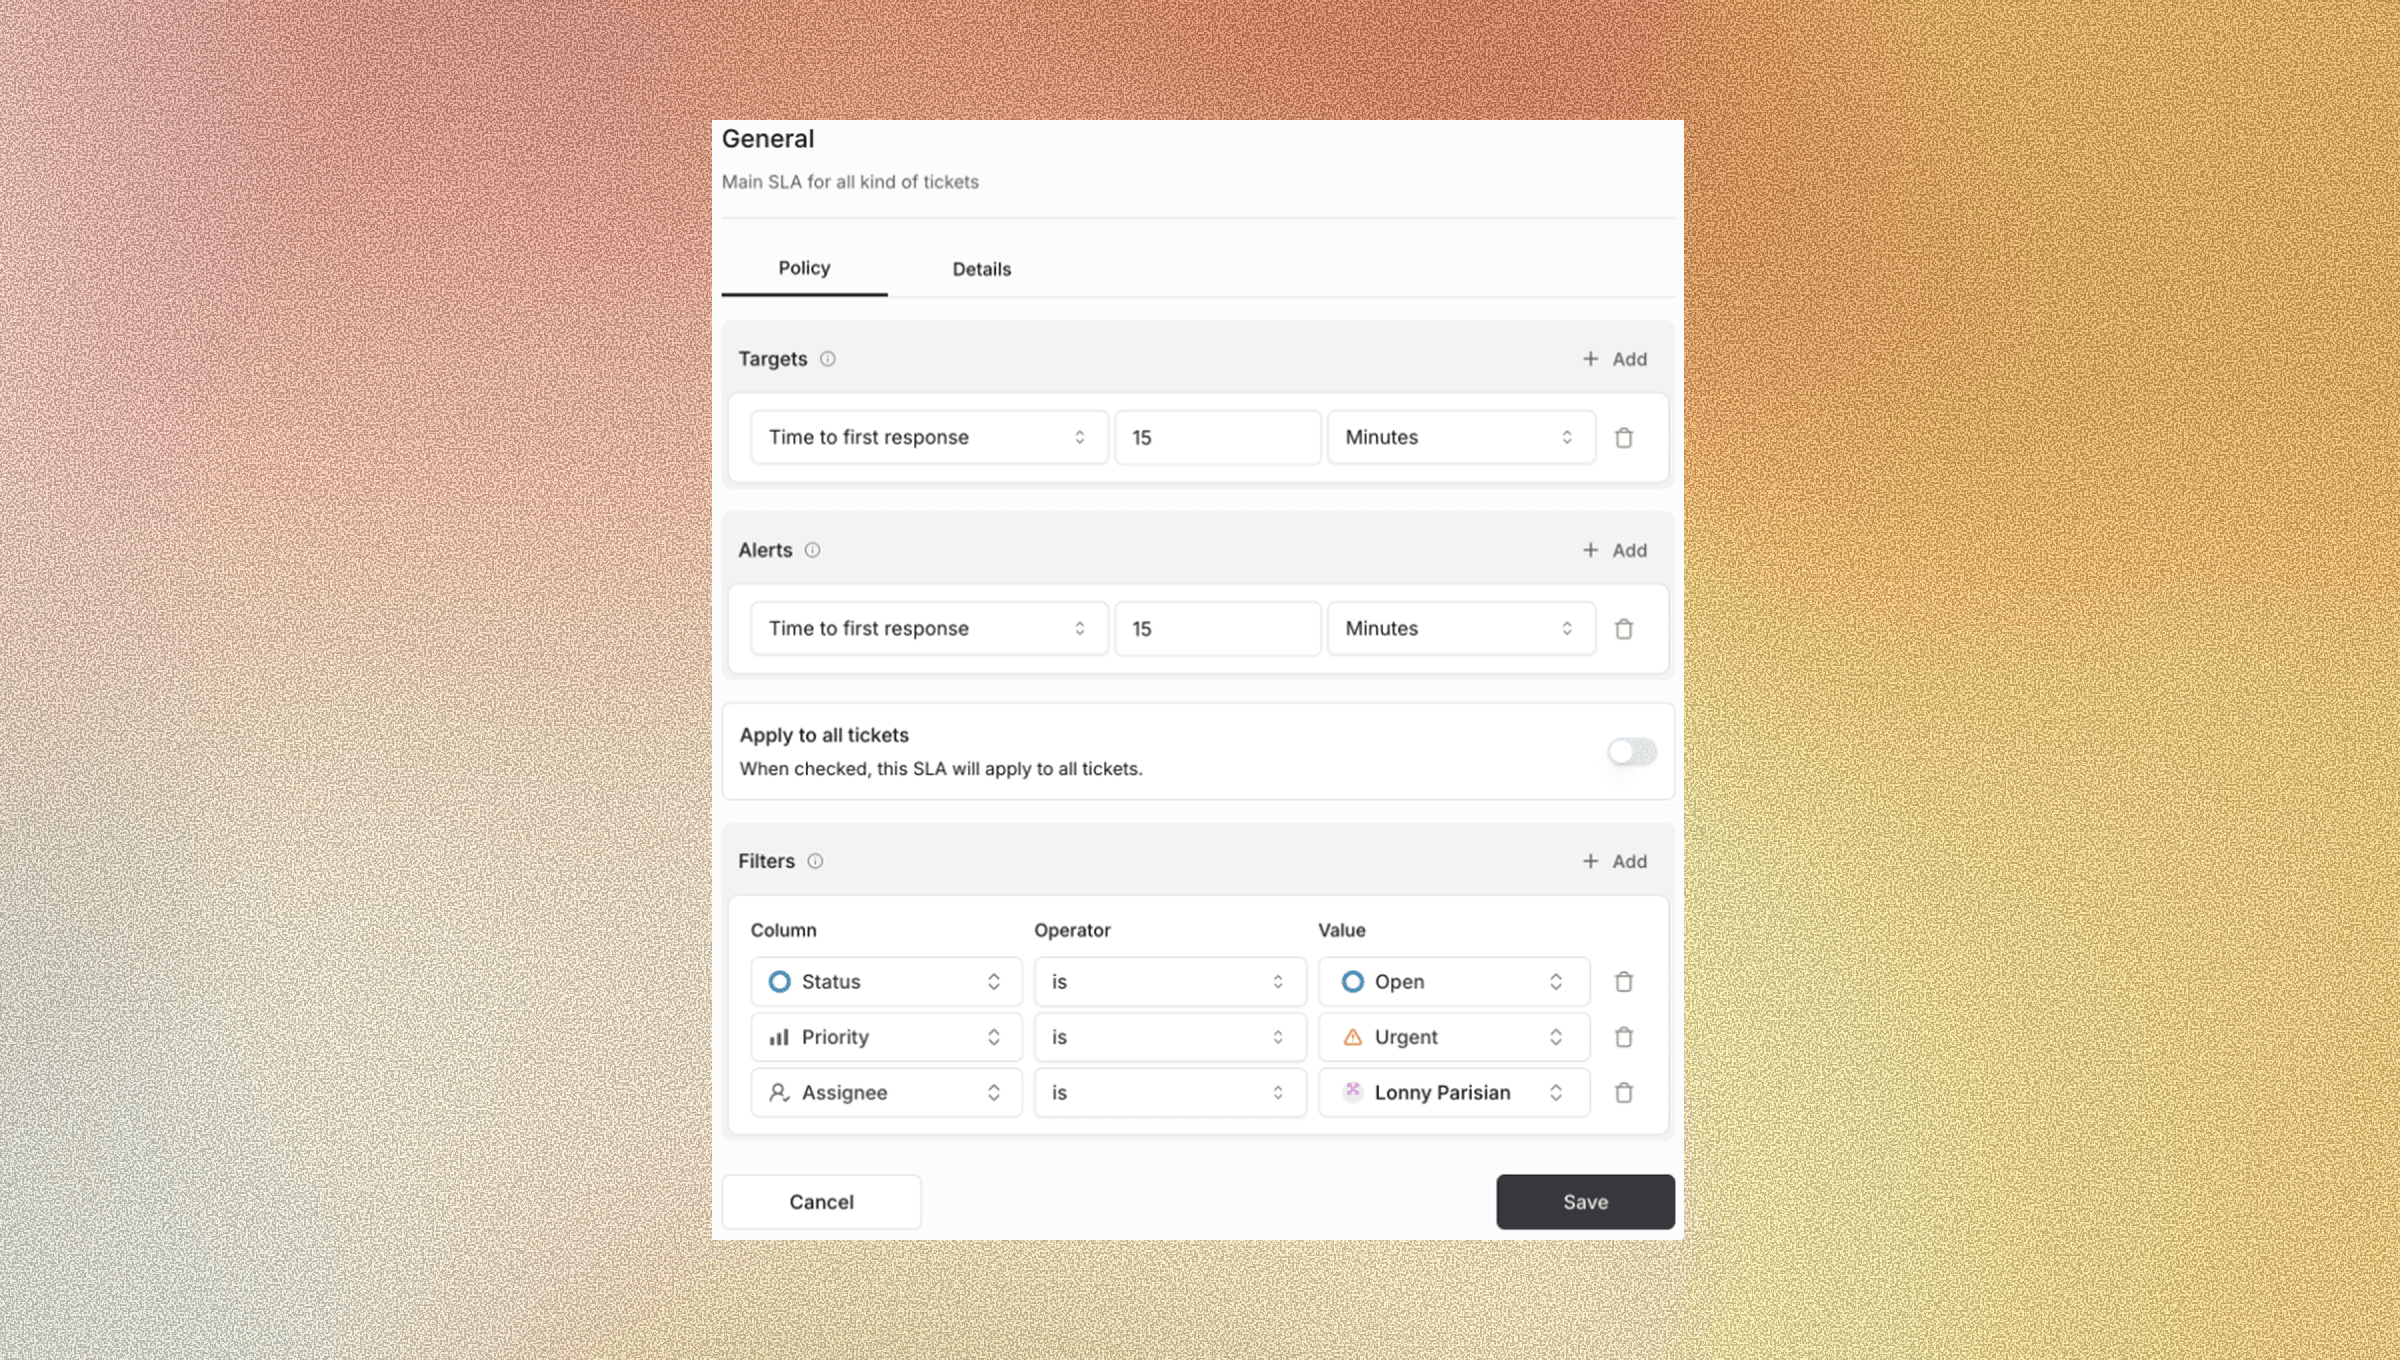
When comparing ITSM solution providers, look for visual reporting tools that focus on clarity over complexity. Clean, intuitive designs help teams quickly identify trends and outliers without getting lost in data overload. The goal is actionable insights, not impressive graphics. Coupled with automated alerting, ITSM dashboards become central to how you manage and resolve IT service issues.
When service level agreements (SLA) breaches are imminent or ticket volumes spike unexpectedly, proactive notifications allow rapid response before problems escalate.
4. Build Continuous Improvement Through Performance Analytics
Performance analytics form the backbone of continuous ITSM improvement. High-performing organizations set regular review cycles that connect operational metrics to business impact, so ITSM processes can evolve alongside organizational needs.
The most effective feedback loops link service delivery data to measurable outcomes. Tracking CSAT alongside resolution time, for instance, reveals whether faster responses actually enhance user experience or simply trade speed for quality.
In 2025, mature ITSM teams formalize this closed-loop model by continuously refining automation systems using telemetry, customer feedback, and business metrics to drive measurable improvements.
Improvement Area | Key Metrics | Review Frequency | Example Action Triggers |
Service Quality | CSAT, FCR, Resolution Time | Weekly | Below 80% CSAT |
Daily Performance | Cost per Ticket, MTTR | Monthly | >15% increase |
Business Alignment | ROI, Process Automation | Quarterly | Misaligned objectives |
New Solutions | New Solutions, Knowledge Growth | Bi-annually | Stagnant metrics |
Continuous improvement does not rely solely on manual review. Modern workflow automation platforms increasingly generate these insights automatically. In 2025, AI-driven analytics detect service patterns, predict user needs, and trigger proactive adjustments before issues escalate.
Success isn’t defined by perfect metrics but by consistent progress. Workflow automation platforms that embed AI and analytics directly into daily operations make that progress measurable, turning every improvement into real business value.
Final thoughts on ITSM reporting that drives real outcomes
The difference between reactive IT teams and proactive service organizations comes down to how effectively you use data. When you move beyond vanity metrics and focus on business-aligned KPIs and predictive insights, IT becomes a value driver rather than a cost center. Ravenna’s analytics focus on improving service execution and automation effectiveness, not infrastructure monitoring or capacity planning. By embedding AI-powered analytics into daily workflows, modern workflow automation platforms support smarter decisions that move organizations forward.
FAQs
Why do most ITSM reports fail to drive real business value?
Because most teams measure activity, not impact. Traditional metrics like ticket counts or resolution times don’t show whether IT services actually improve business outcomes. Strategic reporting, on the other hand, connects IT performance directly to business objectives, yet only a small percentage of IT teams actually track business-success-related metrics.
How can AI improve ITSM reporting and service management?
AI makes predictive analytics possible, spotting patterns in incidents, capacity, and user behavior before problems occur. Companies using predictive ITSM tools may see up to 45% fewer unplanned outages. Tools like Ravenna integrate these capabilities directly in Slack, providing real-time insights and automated triggers for proactive issue resolution.
What’s the difference between traditional reports and real-time dashboards?
Traditional reports are static snapshots, useful for audits or long-term planning. Real-time dashboards, by contrast, update continuously, giving teams instant visibility into ticket volumes, SLA breaches, and workload trends.
How does Ravenna simplify ITSM reporting?
Ravenna is a Slack-native workflow automation platform that coordinates end-to-end workflows across tools, teams, and systems. It automates categorization, generates real-time dashboards, and executes complex workflows directly within Slack, allowing IT teams to act on data without context-switching between multiple tools.


