

When was the last time you calculated cost per ticket for your help desk? Most IT leaders can estimate resolution time or monthly ticket volume, but the fully loaded cost of a single manually handled request is harder to pin down. Before you can measure AI automation ROI, you need that baseline number. Then you need to know which requests your AI agents resolved without any human touchpoint, how many hours that recovered each week, and what those hours cost at your team's blended rate. The ROI case lives in that gap between manual and autonomous work.
TLDR:
Calculate your baseline cost per ticket before automation: multiply monthly IT support hours by your blended hourly rate, then divide by ticket volume to see where you start.
Measure deflection rate by request category (password resets and access requests deflect at a meaningfully higher rate than complex troubleshooting by month 4) then multiply deflected volume by your cost per ticket to get real savings.
Avoid the biggest ROI mistake: projecting best-case pilot deflection rates across full ticket volume overstates annual savings because easy requests like password resets automate faster than complex troubleshooting.
Track four metrics that drive ROI: ticket deflection rate and cost per ticket for direct savings, plus mean time to resolution and agent utilization for productivity gains that compound over time.
Ravenna's AI agents resolve software access, MFA resets, and offboarding end-to-end in Slack with analytics showing exact AI vs. human resolution rates and recovered hours for your business case.
What AI Automation ROI Actually Means for IT Help Desks
Traditional IT ROI thinking tracks tickets closed, time-to-resolution, and cost per incident. For AI automation, those metrics miss where the real value lives. According to AI automation ROI metrics research, what actually reflects automation value is deflection rates, auto-resolution percentages, and human hours eliminated from repetitive work each week.
Most IT teams measure outcomes of a broken process instead of the cost of running it. A ticket resolved in two hours still required a human to triage, execute, and close it. Real AI automation ROI asks whether that sequence of manual work needed to happen at all.
The Full Cost Picture: What to Include in Your ROI Calculation
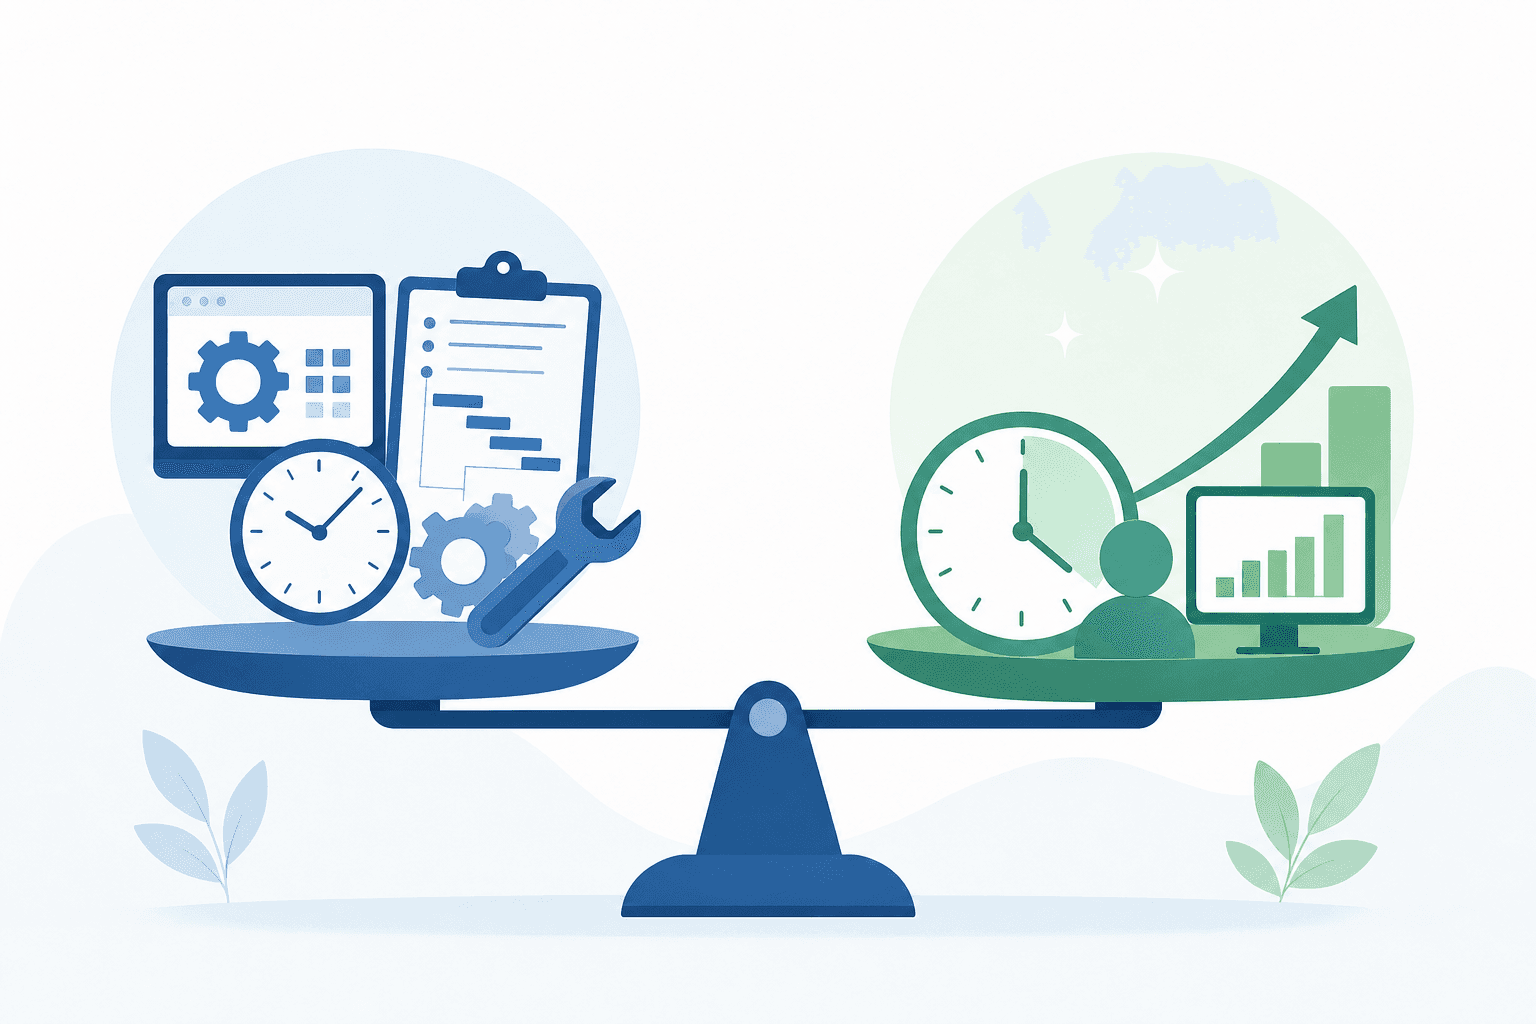
When calculating AI automation ROI, most teams default to counting tickets resolved. The real cost picture is wider than that. There are two sides to the equation: what you spend to deploy and run AI automation, and what that automation recovers for you.
Costs to include
Software licensing or subscription fees for your AI automation tool
Implementation time, including any IT staff hours spent on configuration and testing
Ongoing maintenance and prompt tuning as your environment changes
Training time for staff learning new workflows
Value to capture
Labor hours recovered from ticket triage, routing, and manual resolution
Reduced mean time to resolution (MTTR), which cuts downstream productivity loss for the employees waiting on IT
Ticket deflection volume, meaning requests resolved without any human touchpoint
Lower escalation rates, since fewer tickets reach senior engineers when Tier 0 and Tier 1 are handled autonomously
The table below gives you a structured view of where each dollar flows.
Cost Category | Example Input |
|---|---|
Annual software cost | Subscription fee |
Implementation hours | Staff time at loaded hourly rate |
Tickets deflected per year | Volume x avg. handling cost |
MTTR improvement | Hours saved x requestor hourly rate |
Escalation reduction | Senior engineer hours recovered |
Getting this right means your ROI number reflects what actually changed, instead of what the software can theoretically do.
Key Metrics That Drive IT Help Desk Automation ROI
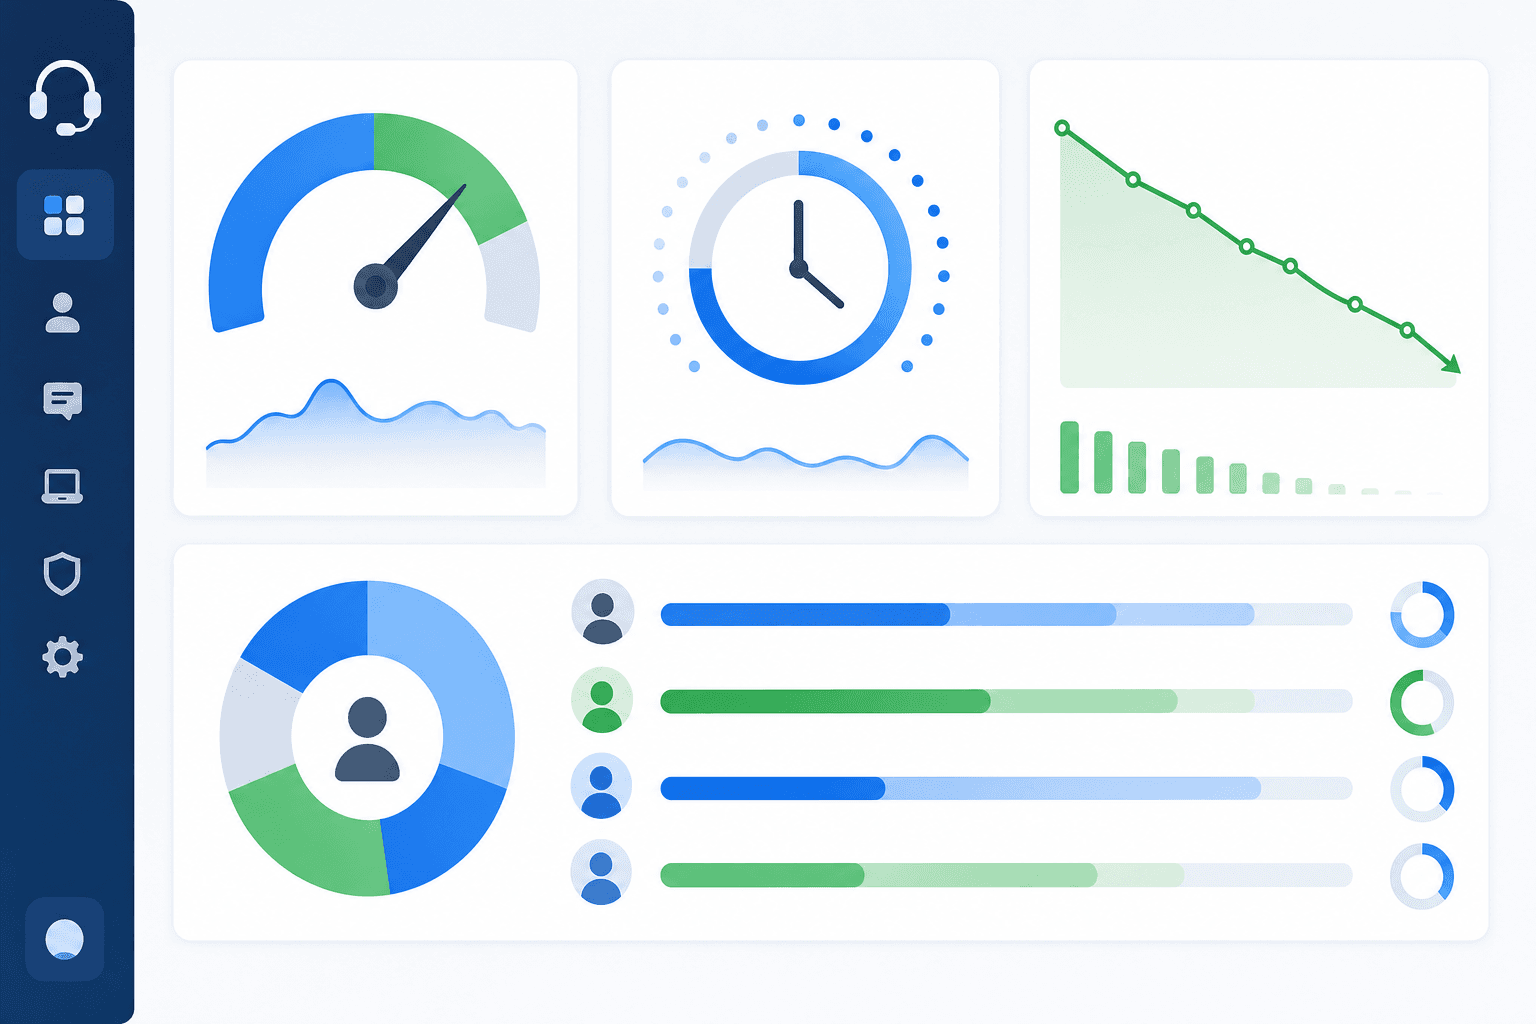
Before you can calculate AI automation ROI, you need to know which numbers actually move the needle. Most IT teams track ticket volume and resolution time, but those metrics only tell part of the story.
Here are the metrics worth measuring:
Ticket deflection rate: the percentage of incoming requests resolved without a human agent touching them. This is where autonomous AI resolution shows up directly in cost savings.
Mean time to resolution (MTTR): how long it takes from request submission to a fully resolved issue. Reductions here reflect both speed and reduced back-and-forth.
Cost per ticket: total support costs divided by ticket volume. Even modest deflection rates can move this number substantially at scale.
Agent utilization: the proportion of time your IT staff spends on repetitive, automatable requests versus strategic work. High utilization on low-value tasks is the clearest signal that automation ROI will be strong.
Employee satisfaction (ESAT): resolution speed and self-service success both feed into how employees perceive IT support quality.
Each of these feeds into your ROI calculation differently. Deflection rate and cost per ticket drive direct cost reduction. MTTR and ESAT affect productivity and retention outcomes that show up as softer but real financial value. Agent utilization ties directly to whether your team can absorb headcount growth without adding staff.
How to Calculate Cost Per Ticket Before and After Automation
Cost per ticket is one of the most telling numbers in any IT help desk budget, and it's often higher than teams expect. Once you factor in technician time, tooling overhead, and escalation handling, the fully-loaded cost of a manually handled IT support ticket can vary widely depending on team size and request complexity.
Calculating your pre-automation baseline starts with three inputs:
Total IT support staff hours spent on ticket handling per month (including triage, resolution, and follow-up)
Average fully-loaded hourly cost of those staff members
Total ticket volume for the same period
Divide total labor cost by ticket volume and you have your cost per ticket. A team spending 200 hours monthly at a blended $50/hour rate across 1,000 tickets lands at $10 per ticket in labor alone. Add tooling, escalation time, and management overhead and that number climbs fast.
Post-automation, the same formula applies, but the inputs change. AI agents handle a portion of requests without any human touchpoint. The tickets that do reach humans are pre-triaged, enriched with context, and routed correctly the first time, so resolution time drops.
The table below shows how those inputs shift across a realistic before-and-after scenario.
Input | Before Automation | After Automation |
|---|---|---|
Monthly staff hours on tickets | 200 hrs | 110 hrs |
Blended hourly cost | $50 | $50 |
Monthly labor cost | $10,000 | $5,500 |
Ticket volume | 1,000 | 1,000 |
Cost per ticket | $10.00 | $5.50 |
The gap between those two numbers is where your AI automation ROI calculation begins.
Quantifying Time Savings from Automated Workflows
The formula is straightforward: weekly hours saved multiplied by your fully-loaded hourly rate, multiplied by 52 weeks. A team of 5 IT analysts each recovering 8 hours per week from password resets and access provisioning at a $50/hour blended rate generates $104,000 in annual savings from labor alone, per AI automation savings research.
The workflows that move this number fastest are repeatable requests like password resets, access provisioning, and software license assignments. Each follows a predictable resolution path, which makes them both easy to automate and easy to measure after the fact.
Measuring Ticket Deflection and Self-Service Impact
Ticket deflection is one of the clearest signals of AI automation ROI, and one of the most commonly miscalculated.
The basic formula is straightforward: divide the number of tickets resolved without human intervention by your total ticket volume over the same period. But the number that comes out of that calculation is only useful if you're measuring the right things going into it.
There are a few metrics worth tracking here:
Deflection rate by request category: password resets, access requests, and software provisioning will deflect at very different rates than complex troubleshooting tickets. Blending them into a single rate obscures where automation is actually working.
Time-to-resolution for deflected tickets versus agent-handled tickets: this gap is where much of the labor cost savings live.
Self-service completion rate: how many users who initiated a self-service flow actually finished it without abandoning and filing a ticket anyway.
Re-open rate on deflected tickets: a deflected ticket that gets re-opened means the resolution was incomplete, which inflates your apparent deflection rate while masking the real failure.
Once you have clean deflection data by category, you can attach dollar figures. Multiply the count of deflected tickets in each category by your fully-loaded cost per ticket for that type. That gives you a savings figure grounded in your actual cost structure, not an industry average that may not reflect your team's reality.
Realistic ROI Timeframes for IT Help Desk Automation
Most teams expect AI automation to pay off within 6-12 months. The reality is more complex, and planning around the wrong timeline can make a real ROI calculation look worse than it is.
Here's how the phases tend to break down.
Month 1-2: Setup and Baseline
The first weeks are about getting the system connected, trained on your knowledge sources, and handling a subset of ticket categories. ROI is minimal here, but this is when you capture your pre-automation baseline numbers: average handle time, ticket volume by category, and analyst hours per week.
Month 3–4: Initial Automation Gains
Autonomous resolution rates start climbing. Common requests like password resets, software access, and onboarding tasks get resolved without human touchpoints. Teams begin to see a meaningful share of eligible ticket volume handled automatically by the end of this window.
Month 5–6: Compounding Returns
As the system handles more volume and edge cases get refined, deflection rates rise and analyst time moves toward higher-complexity work. This is where the ROI calculation starts returning meaningful positive numbers.
Beyond Month 6
Teams that reach this stage with clean data often find their actual ROI exceeds early projections, because the avoided costs compound: fewer escalations, faster mean time to resolution, and reduced after-hours support load all contribute to numbers that weren't fully visible at the start.
Common ROI Calculation Mistakes IT Leaders Make
Four mistakes show up repeatedly in IT help desk ROI calculations, and each one distorts the result in the same direction.
Projecting from best-case deflection: pilots often run on highest-deflection categories. Extrapolating those rates across full ticket volume will overstate annual savings considerably.
Ignoring adoption lag: if employees keep DMing IT directly instead of going through the AI-assisted channel, deflection figures look artificially low even when the automation itself is working correctly. Adoption rate is an input to your ROI model, not an afterthought.
Measuring time saved without a dollar translation: "We recovered 40 hours a month" is a data point. Multiply by fully-loaded hourly cost, or the number means nothing to finance or leadership.
Omitting opportunity cost: hours your IT staff spend on manual triage are hours not spent on higher-value infrastructure or security work. Most ROI models ignore that foregone value entirely, which understates the real return.
Building Your ROI Business Case for Stakeholders
Once you have your numbers, the harder job is getting someone to act on them. Finance and leadership teams respond to business cases that speak their language: payback period, net present value, and risk-adjusted return.
Here is a simple way to frame the case. Take your first-year net benefit, divide it by total implementation cost, and multiply by 100 to get your ROI percentage. Then divide the total cost by the monthly net benefit to get payback period in months. Keep both figures in your executive summary.
A few factors that strengthen any ROI submission:
Tie savings to headcount capacity, not headcount reduction. Showing that automation frees 15 hours per week per analyst for higher-value work is a far easier sell than implying staff cuts.
Include a conservative scenario alongside your base case. Cutting projected savings by 30% and showing the business case still holds adds credibility with skeptical reviewers.
Separate one-time costs from ongoing costs in your model so finance can see the recurring benefit clearly after year one.
Quantify risk cost. Unresolved tickets carry real exposure: SLA breaches, compliance gaps, and employee downtime all have dollar values that belong in the model.
The goal is a document that answers the two questions every approver asks: how long until we break even, and what happens if the projections are off?
How Ravenna's AI Agents Deliver Measurable Help Desk ROI
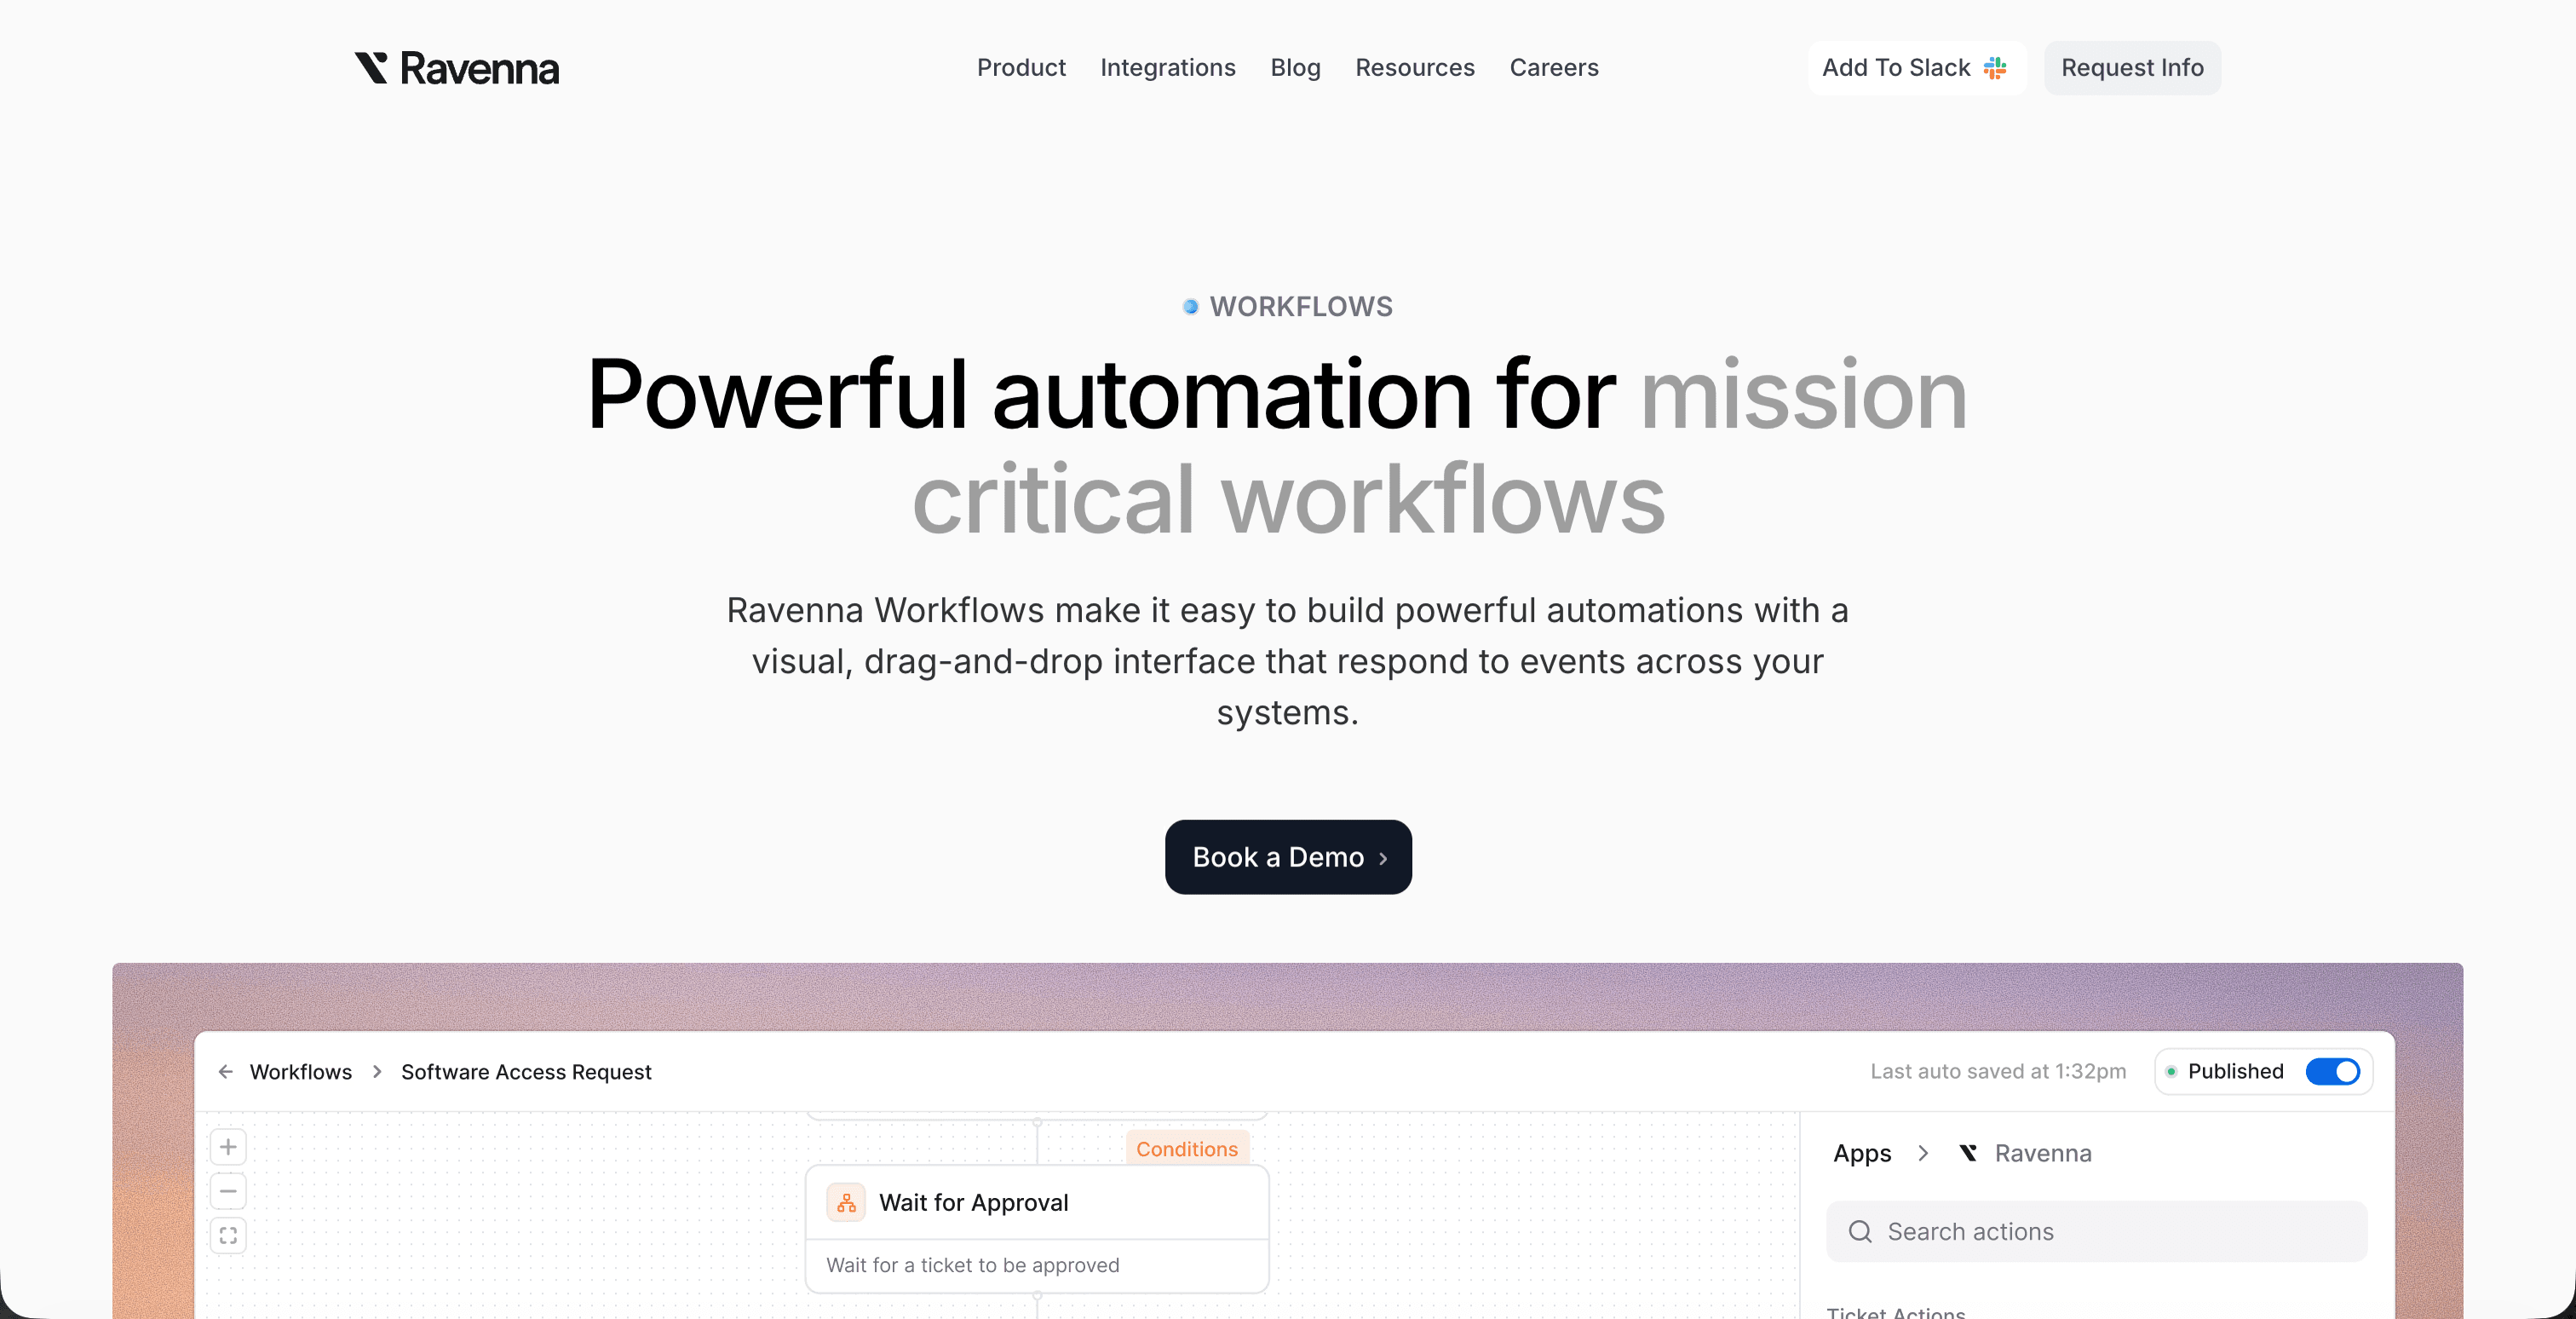
Ravenna is an AI-native workflow automation platform built for exactly this kind of calculation. Instead of routing requests to a human queue, Ravenna's AI agents resolve them end-to-end directly inside Slack: software access, MFA resets, offboarding, and diagnostics all run autonomously, without anyone on your team touching them.
The custom analytics dashboards make the ROI case concrete. The AI vs. Human Resolution rate shows the exact percentage of requests your team never had to handle. Paired with cost-per-ticket reduction and recovered hours, those figures give you a business case grounded in actual execution data instead of projected deflection models.
Deployment starts with pre-built workflow templates that go live in minutes, which means baseline metrics and automation gains are visible in the first month, well before a traditional rollout would finish configuration.
Final Thoughts on IT Automation ROI That Holds Up
AI automation ROI stops being theoretical the moment you measure deflection rates, cost per ticket, and hours recovered instead of tickets closed. Those metrics show you whether your automation is resolving work or just tracking it better. You can reach out to our team to see what those numbers look like when AI agents handle password resets, access requests, and onboarding end-to-end without your team touching them.
FAQ
How do you calculate cost per ticket before and after AI automation?
Multiply your monthly IT support hours by your blended hourly rate, then divide by ticket volume to get your baseline cost per ticket. After automation, repeat the formula with reduced staff hours handling tickets. The deflected requests handled by AI agents drop your total labor cost while volume stays the same, cutting your cost per ticket accordingly.
What's the biggest mistake IT leaders make when calculating automation ROI?
Projecting from best-case deflection rates. Most pilots run on the easiest request categories like password resets and software access, then teams extrapolate those rates across full ticket volume which overstates annual savings considerably since complex troubleshooting tickets deflect at much lower rates.
Can you measure AI automation ROI without waiting 12 months?
Yes. Initial automation gains often emerge within the first several months as AI begins resolving routine requests such as password resets and access-related tasks, reducing ticket volumes and increasing autonomous resolution rates for common support workflows. Track deflection rate by category, multiply by your cost per ticket, and you'll have actual savings figures before month 6.
When should you include opportunity cost in your ROI model?
Always. Hours your IT staff spend on manual triage are hours not spent on infrastructure work, security improvements, or strategic projects. Most ROI models ignore that foregone value entirely, which understates the real return, especially when senior engineers handle Tier 1 work that could run autonomously.
What metrics actually drive help desk automation ROI?
Ticket deflection rate and cost per ticket drive direct savings, while mean time to resolution (MTTR) and agent utilization affect productivity outcomes. Deflection shows how many requests resolve without human touchpoints, cost per ticket translates that into dollar savings, and MTTR cuts downstream productivity loss for employees waiting on IT.