

When your IT team closes 2,000 tickets a month and your automation program handles 600, leadership sees a win. But if those 600 automated tickets would take five minutes each manually while the remaining 1,400 require 30 minutes, your AI automation is solving the wrong problems.
Traditional KPIs hide that reality because they treat all tickets the same. You need visibility into which request types consume the most human hours, where automation coverage is thin, and whether workflows are reused or rebuilt from scratch to properly measure AI performance. Autonomous resolution rate by category, hours reclaimed per workflow type, and reuse rate across teams become the metrics that guide your build priorities. When you track those, your automation program stops chasing ticket counts and starts reclaiming capacity using the right AI KPIs.
TLDR:
Track automation coverage and autonomous resolution rates to measure AI effectiveness beyond speed alone.
AI automation reduces MTTR by 40-70% and can cut IT service desk costs by up to 40%.
Calculate human hours reclaimed by multiplying automated volume by handle time and labor costs.
Break metrics down by request category to spot workflow gaps and focus your automation builds.
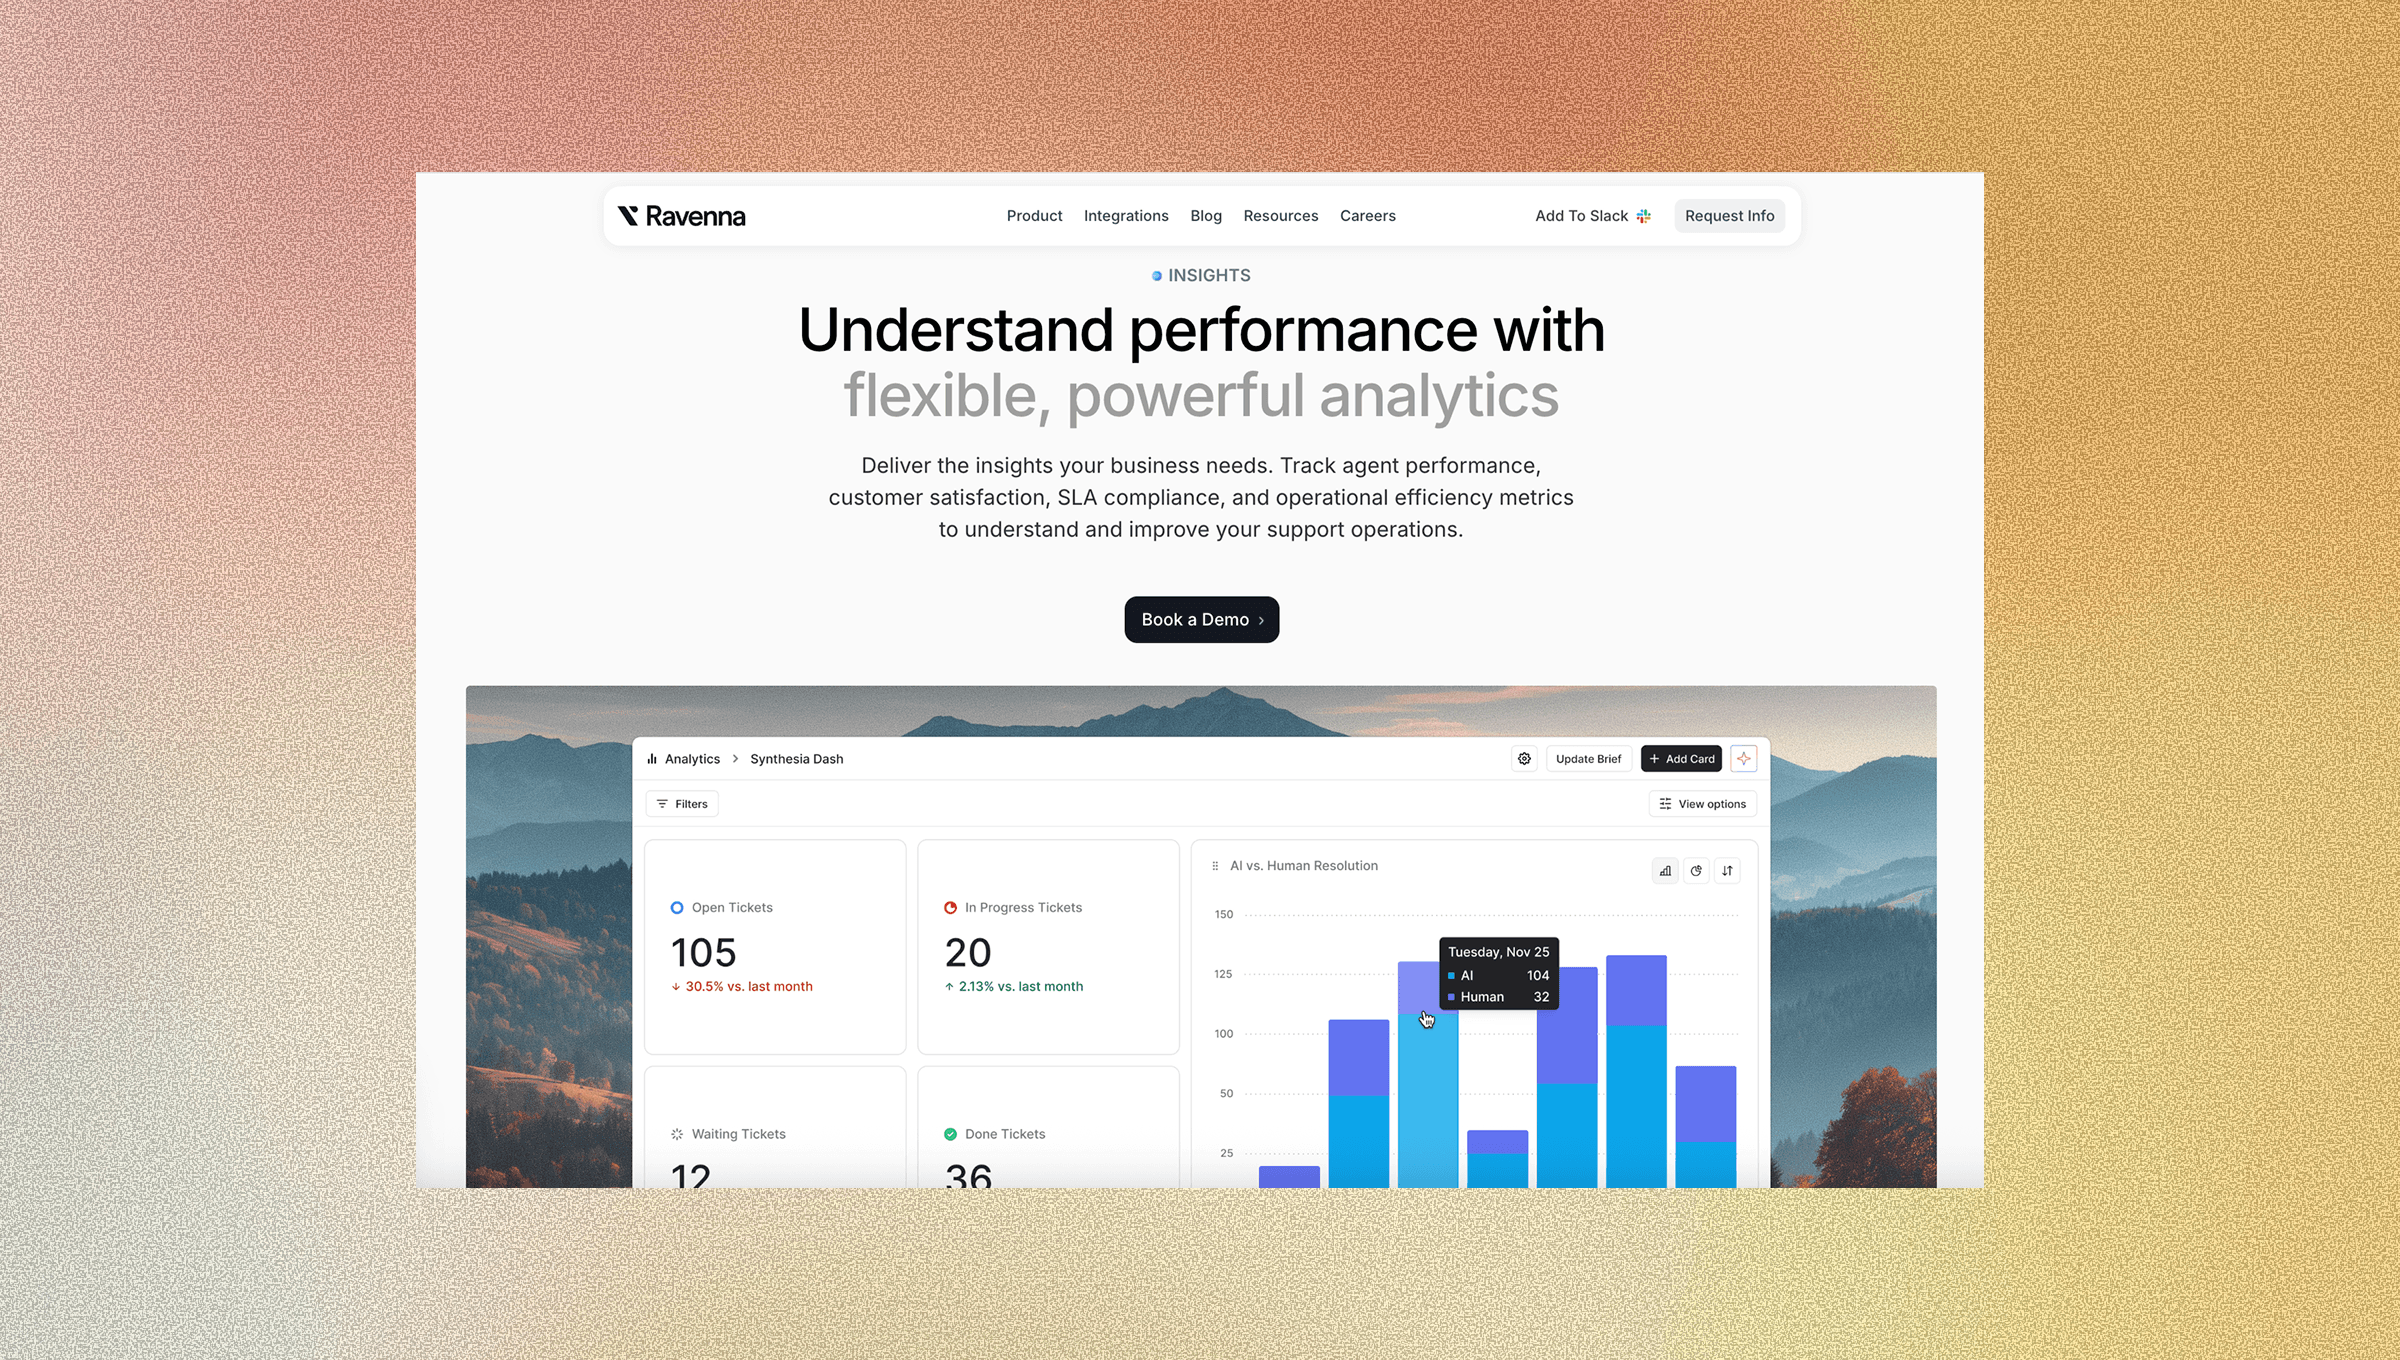
Ravenna tracks AI vs. human resolution splits and deflection insights to close the loop from measurement to workflow improvement.
Why Traditional IT Metrics Fall Short in an AI-First World
Traditional IT metrics were built for a different era. Response time, SLA compliance, and ticket close rates made sense when every request touched a human. They no longer tell the full story.
These KPIs were built to measure human throughput, not automation effectiveness. When an AI agent resolves an access request in 30 seconds without any human involvement, your average response time looks great. But you're still not measuring what actually matters: how much of your queue never needed a human at all.
Legacy IT metrics answer "how fast did we respond?" AI-first metrics measure work eliminated.
There's a real cost to measuring the wrong things. Teams optimizing for ticket close rates will keep closing tickets instead of building automation that prevents them. SLA compliance scores climb while IT staff still burns hours on password resets and software provisioning. The scoreboard looks good. The workload stays the same.
The KPIs worth tracking in 2026 are built around a different question: what percentage of your IT work is running without anyone touching it? That's where autonomous resolution rate, deflection rate, and human hours reclaimed become the metrics that matter.
Digging Into the Metrics That Matter
So what metrics matter? What should you measure? What benchmarks should each metric have to guide decision-making? The table below provides a quick overview of the KPI metrics, what they measure, and why they matter.
KPI Metric | What It Measures | Target Benchmark | Why It Matters |
Automation Coverage Rate | Percentage of IT request categories that can be handled by AI without human involvement | 50% or higher for mature programs | Shows breadth of your automation program and reveals workflow gaps across request types |
Autonomous Resolution Rate | Percentage of tickets resolved completely by AI from start to finish without escalation | 60% or higher for access requests, password resets, device management | Measures whether AI is executing real work versus just answering questions, directly linked to cost reduction |
Ticket Deflection Rate | Support requests resolved before a formal ticket is created | 20-60% deflection across support volume | Prevents tickets from entering the queue entirely, compounding capacity gains across high-volume operations |
MTTR Reduction | Time saved in detecting, diagnosing, remediating, and verifying incident resolution | 40-70% reduction within 6-18 months | Compresses resolution time across all phases through AI pattern recognition and automated remediation |
Human Hours Reclaimed | Total labor hours freed by automation calculated as automated volume times handle time | Track monthly trend and convert to dollar value | Provides concrete ROI case for leadership showing what automation freed up in actual cost terms |
Workflow Reuse Rate | How often existing automations are duplicated or adapted for new use cases | 40% or higher of new automations from existing templates | Indicates whether automations are composable or brittle one-off solutions, impacts maintenance costs |
AI vs Human Resolution Split | Percentage breakdown of requests handled by AI versus human agents by category | Track quarterly trend moving toward higher AI resolution | Reveals which request types are automation-ready versus requiring human judgment, guides build priorities |
Automation Coverage Rate
Automation coverage rate measures the percentage of IT requests your AI can handle without a human ever getting involved. It acts as a readiness score for your automation program. The higher it climbs, the less your team is stuck fielding repetitive work.
Why It Matters as a Baseline Metric
Most IT teams know they're automating something. Few know what percentage of their total request volume is actually covered. That gap matters. A majority of enterprises are working towards automating their network activities, which means coverage rate is quickly becoming a competitive baseline, not a vanity metric.
A low coverage rate does not always mean your AI is failing. Often, it reveals workflow gaps: categories of requests that were never mapped, never built out, or handled inconsistently across agents. Tracking coverage forces those gaps into view.
How to Calculate It
Total automated request categories divided by total request categories in your queue. This shows the breadth of your automation program across different request types.
Volume of requests handled without human touchpoints divided by total request volume. This shows scale and how much of your actual workload AI is absorbing.
Tracking both gives you a clearer picture of where your automation program is mature and where it remains thin.
Autonomous Resolution Rate
Autonomous resolution rate is the percentage of requests your AI resolves completely, start to finish, without escalating to a human. No agent involvement, no approval ping, no follow-up thread. The request comes in, the AI acts, the issue closes. This separates it from deflection rate, which we’ll cover next.
Deflection means a ticket was never created. Autonomous resolution means a ticket came in and AI handled the entire thing anyway. Both matter, but resolution rate is where you measure whether your AI can actually do the work.
Why This Is the Metric That Counts
A high resolution rate tells you something specific: your AI agents are executing real work instead of answering questions. For IT teams, that's the difference between a chatbot that explains how to request software access and an agent that grants it. AI automation can reduce IT service desk costs significantly, and the autonomous resolution rate is the most direct line between your automation program and those savings.
What to Watch
Target 60% or higher for mature automation programs handling access requests, password resets, and device management.
Flag any request category with under 20% autonomous resolution as a workflow build priority.
Track resolution rate by request type instead of overall figures, since aggregate numbers hide where your AI is actually struggling.
When this rate climbs, your team’s capacity grows without adding headcount.
Ticket Deflection Rate
Ticket deflection rate measures how many support requests get resolved before a formal ticket is ever created. A user asks a question, the AI answers it from the knowledge base, the issue closes. No ticket, no queue entry, no agent time spent. The distinction from autonomous resolution rate is worth noting: resolution handles tickets that were already created. Deflection stops them from entering the queue at all. Done right, effective deflection cuts support volume by 20-60%, which compounds quickly across a high-volume IT operation.
One caveat: deflection only creates value when users actually get what they need. Deflecting a request that still leaves someone stuck is just friction dressed up as a metric. Track deflection rate alongside user satisfaction signals. If deflection climbs but satisfaction drops, your knowledge base has gaps, not wins.
Break deflection rate down by topic category to see where self-service is working and where users consistently skip it and submit tickets anyway.
Mean Time to Resolution Reduction
MTTR measures how long it takes to resolve an incident from detection to closure. For IT teams, it's one of the clearest signals of system health and one of the first places AI automation makes a measurable dent.
AI compresses MTTR across every phase of resolution. Detection gets faster through pattern recognition that flags anomalies before users submit tickets. Diagnosis accelerates because AI can cross-reference historical incidents and surface likely root causes in seconds. Remediation shortens when AI agents execute fixes directly. Verification closes the loop automatically. Organizations using AI for incident management commonly see 40-70% MTTR reduction within 6-18 months, though results depend on clean data and process changes.
Track MTTR by incident category. Aggregate numbers smooth over the areas where AI is underperforming.
Human Hours Reclaimed
To calculate hours reclaimed, multiply automated request volume by average handle time per request type, then convert it to cost using fully loaded IT labor rates. That number becomes your reinvestment case for leadership.
Breaking Down the Calculation
A few inputs you need to get this right:
Your average handle time per request category (password resets, access provisioning, software installs) since these vary widely and blending them distorts the total.
Fully-loaded labor rates including benefits, overhead, and opportunity cost, because all of these factor into the true cost per hour.
Automated request volume tracked monthly so you can show a trend instead of a single snapshot.
The resulting figure shows leadership the business value and business impact of what AI automation freed up in dollars instead of ticket counts alone.
Workflow Reuse Rate
Workflow reuse rate tracks how often existing automation gets duplicated or adapted for new use cases. If you build a software access workflow for Engineering and then copy it for Finance with minor adjustments, that's reuse. It means your original build had enough structure to travel.
Low reuse rate is a warning sign. It suggests your automation was built as one-off solutions, tightly coupled to a single context and brittle by design. Every new request type requires a net-new build, and when something breaks, there's no shared foundation to fix once and benefit everywhere.
High reuse rate signals the opposite: your automation program is composable. New workflows ship faster because the logic already exists. Maintenance costs drop because changes propagate across adapted versions. Track this by monitoring how often your team duplicates existing workflows versus building from scratch, and set a target of at least 40% of new automations starting from an existing template.
AI vs Human Resolution Split
The AI vs. human resolution split tracks what percentage of resolved requests were handled by AI versus a human agent, broken down by request category. Over time, the trend line tells you more than the snapshot. A split moving from 40/60 to 70/30 over two quarters shows your automation program is maturing. A split that stays flat means something is stalling.
Where this metric earns its place is in planning. When you break the split down by request type, patterns surface fast:
Access requests sitting at 85% AI resolution are effectively done.
Procurement approvals stuck at 20% AI resolution point to a workflow gap or a training data problem worth fixing.
The split stops being a report and starts being a build list.
Use it to separate two distinct problems: request categories where AI has not been trained to act yet, and categories where human judgment is genuinely required. Both show up as low AI resolution, but they need different responses. One needs a workflow build. The other needs a clear escalation path.
How Ravenna's Analytics Suite Changes KPI Measurement for IT Operations
Tracking KPIs only helps if your data is reliable. Portal-based ITSM tools chronically undercount request volume because employees route around them. Ravenna's Slack-native approach drives near 100% adoption, which means your deflection rate, resolution split, and hours-reclaimed figures reflect reality instead of a partial sample.
The analytics suite connects directly to what the previous sections laid out, with real-time dashboards that surface performance instantly. Autonomous resolution tracking shows which workflows run end-to-end without human touchpoints. Time savings dashboards and analytics dashboards convert automated request volume into hours and cost. Deflection insights surface knowledge base gaps so you can build articles before ticket volume tells you to.
When a KPI reveals an optimization gap, Ravenna’s AI platform and visual workflow builder let you act on it immediately. Spot a request category stuck at low AI resolution? Build or adapt a workflow without writing code. The loop from measurement to improvement closes quickly, and that’s where compounding gains happen.
Final Thoughts on Making AI Automation Measurable in IT
Tracking AI automation KPIs means deciding whether you want to measure throughput or elimination. Autonomous resolution rate, deflection rate, and hours reclaimed tell you if your team is gaining capacity or just maintaining the same workload faster. Split these metrics by request category to see where automation is mature and where it needs attention. Connect with us to see how Ravenna surfaces these insights without requiring you to build custom reporting.
FAQ
What's the difference between the autonomous resolution rate and ticket deflection rate?
Autonomous resolution rate measures requests that entered your queue and were resolved completely by AI without human involvement, while deflection rate tracks how many support requests were resolved before a ticket was ever created. Both drive down IT workload, but they target different stages of the support funnel.
How do I calculate human hours reclaimed from AI automation?
Multiply your automated request volume by the average handle time for each request category (password resets, access provisioning, etc.), then convert that to cost using fully-loaded IT labor rates, including benefits and overhead. Track this monthly to show leadership the dollar value of what automation freed up.
What autonomous resolution rate should I target for a mature automation program?
Target 60% or higher for mature programs handling access requests, password resets, and device management. Any request category with under 20% autonomous resolution should be flagged as a workflow build priority since it reveals either a training gap or missing automation coverage.
Why does workflow reuse rate matter for IT automation?
Low reuse rate means your automations were built as one-off solutions that require net-new builds for every request type, driving up maintenance costs. High reuse rate (target 40% or higher) signals your automations are composable. New workflows ship faster because the logic already exists, and fixes propagate across adapted versions.
How does Ravenna measure KPIs differently from portal-based ITSM tools?
Portal-based tools chronically undercount request volume because employees route around them, giving you partial data on deflection rates and resolution metrics. Ravenna's Slack-native approach drives near 100% adoption, so your KPI measurements reflect actual request patterns instead of a skewed sample.


